

2017 Q4 and Annual Healthcare IT/Digital Health Funding and M&A Report
Price range: $599.00 through $999.00
2017 Was a Record-Breaking Year for
Healthcare IT & Digital Health Companies
– Find Out Why
Click here to download the executive summary for Mercom’s Q4 and Annual 2017 Digital Health Funding and M&A Report.
The report covers both consumer-centric and patient-centric technologies and sub-technologies, including: Social Health, Mobile Health (mHealth), Telehealth, Personal Health, Rating & Shopping, Health Information Management, Revenue Cycle Management, Service Providers and Security. Click here to see our complete list of technologies.
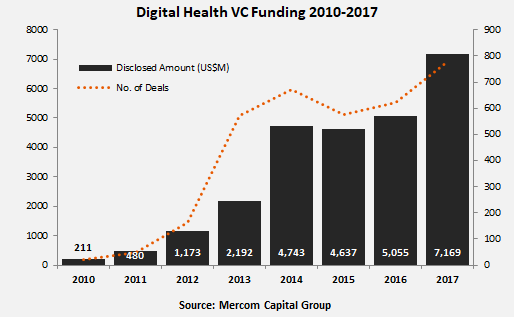
Global venture capital (VC) funding, including private equity and corporate venture capital, in Digital Heath globally witnessed a record-breaking year in 2017 with nearly $7.2 billion raised in 778 deals. This was a 42 percent increase from the previous record set in 2016 of $5.1 billion in 622 deals. Total corporate funding for Healthcare IT companies – including debt and public market financing – climbed to $8.2 billion in 2017, a 47 percent increase from the $5.6 billion raised in 2016.
“Venture capital funding into Digital Health spiked after plateauing the last couple of years. Artificial intelligence and Data Analytics companies had a breakout year with over a billion dollars raised. Digital Health public companies had a much better 2016 compared to previous years with a majority of stocks outperforming the S&P 500. However, a buoyant stock market did not translate into companies going public. For the first time in years we did not see any companies issue an IPO in all of 2017. M&A activity, on the other hand, has been declining slightly over the last few years. Investors do not want to miss out on the sheer size and potential of this growing market, but the exit path for many companies remains elusive,” commented Raj Prabhu, CEO and Co-Founder of Mercom Capital Group.
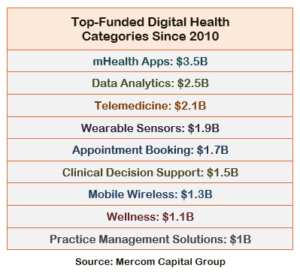
The top funded areas in 2017 included: Data Analytics with $1.1 billion, mHealth Apps with $759 million, Patient Engagement Solutions with $708 million, Telemedicine with $624 million, Appointment Booking with $516 million, and Clinical Decision Support with $514 million.
Data Analytics companies were involved in the most M&A transactions in 2017 with 21, followed by Practice Management Solution companies with 19 transactions, mHealth App companies with 17, and Telemedicine companies with 16 transactions.
The top VC funding rounds in 2017 raised money for: Outcome Health with $500 million, Modernizing Medicine with $231 million, Hudong Feng Technology with $200 million, WuXi NextCode with $165 million, PatientPoint with $140 million, Alignment Healthcare with $115 million, Annoroad with $105 million, and PatientsLikeMe with $100 million.
Data Analytics companies were involved in the most M&A transactions in 2017 with 21, followed by Practice Management Solution companies with 19 transactions, mHealth App companies with 17, and Telemedicine companies with 16 transactions.
![]()
More about the report:
The Annual Report contains annual, year-over-year (YOY) and quarter-over-quarter (QoQ) information on market activity displayed in easy-to-digest charts, graphs, and tables, as well as data-driven analysis.
Our report includes transaction tables for funding and M&A deals, and investor lists for the fourth quarter!
- Venture capital (VC) funding deals, including top investors, YoY and QoQ trends, and charts and graphs broken down by technology and stage
- Practice-focused technology and subgroups
- Consumer-focused technology and subgroups
- VC funding by country and U.S. state
- VC deals with investors and transaction details
- Debt and public market financing deals and investors
- Mergers and acquisition (M&A) transactions and acquirers, including YoY and QoQ trends, a breakdown of charts and graphs by technology and geography
- New Healthcare IT funds
This report is 146 pages long, contains 106 charts, graphs, and tables, and covers 676 investors and companies.
Have questions? Contact us at reports@mercomcapital.com!
RELATED PRODUCTS
Other reports you may be interested in
Venture Capital Funding
in Digital Health Sector
Reaches $15 Billion in 1H 2021
Venture Capital Funding
in Digital Health Sector
Reaches $7.2 Billion in Q1 2021
Bundle and Save ~20%
Get Quarterly Reports + The Annual Wrap
- Claim Your Deal!
Venture Capital Funding
in Digital Health Sector
Reaches $14.8 Billion in 2020
Digital Health VC Funding Hits
$10.3 Billion in 9M 2020
- Get the Details!
Digital Health/Healthcare IT VC Funding Hits
$6.3 Billion in 1H 2020
- Get the Details!
Bundle and Save ~20%
Get Quarterly Reports + The Annual Wrap
- Claim Your Deal!
Venture Capital Funding
in Digital Health Sector
Reaches $3.6 Billion in Q1 2020
Venture Capital Funding
in Digital Health Sector
Reaches $8.9 Billion in 2019
Digital Health VC Funding Hits
$7.2 Billion in 9M 2019
- Get the Details!