

Q1 2020 Digital Health (Healthcare IT) Funding and M&A Report
Price range: $299.00 through $549.00
Venture Capital Funding
in Digital Health Sector
Reaches $3.6 Billion in Q1 2020
Click here to download the Executive Summary.
The report covers both consumer-centric and patient-centric technologies and sub-technologies, including: Social Health, Mobile Health (mHealth), Telehealth, Personal Health, Rating & Shopping, Health Information Management, Revenue Cycle Management, Service Providers and Security. Click here to see our complete list of technologies.
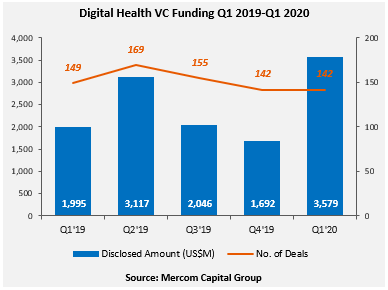
Global venture capital (VC) funding, including private equity and corporate VC into Digital Health companies in Q1 2020, came to a record $3.6 billion in 142 deals compared to $1.7 billion in 142 deals in Q4 2019. VC funding in Q1 2020 increased by 79% compared to the same quarter of last year (Q1 2019) when $2 billion was raised in 149 deals. This was the single largest funding quarter ever for Digital Health.
Digital Health companies have brought in over $47 billion in VC funding in 4,905 deals since 2010.
“There was no evidence of coronavirus affecting digital health funding in Q1. Going forward, we anticipate investors to become more selective in this environment. The era of “I don’t want to miss out” investments may be over. That may not be a bad thing,” said Raj Prabhu, CEO of Mercom Capital Group.
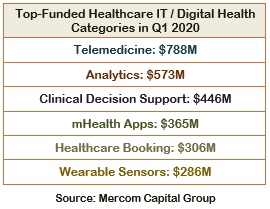
The top-funded categories in Q1 2020 were: Telemedicine with $788 million, followed by Data Analytics with $573 million, Clinical Decision Support with $446 million, mHealth Apps with $365 million, Healthcare Booking with $306 million, and Wearable Sensors with $286 million.
The top VC deals in Q1 2020 included: $285 million raised by Classpass, $250 million from Alto Pharmacy, $155 million raised by KRY, $150 million by Concerto HealthAI, $146 million raised by Element Science, and $144 million by Zhiyun Health.
A total of 433 investors participated in funding deals in Q1 2020 compared to 371 investors in Q1 2019.
There were 14 FDA approvals issued to Digital Health companies in Q1 2020.
In Q1 2020, there were 41 M&A transactions involving Digital Health companies, six of which disclosed transaction amounts. By comparison, there were 44 M&A transactions in Q4 2019, 11 of which disclosed transaction amounts. In a YoY comparison, there were 45 M&A transactions (seven disclosed) in Q1 2019.
The top disclosed M&A transactions included the $600 million acquisition of InTouch Health by Teladoc Health, followed by AMN Healthcare’s acquisition of Stratus Video for $475 million. CompuGroup Medical acquired Cerner’s Medico, Soarian Integrated Care, and Selene business for $248 million, R1 RCM acquired SCI Solutions for $190 million, and Masimo acquired NantHealth’s Connected Care business for $47 million.
The Q1 2020 Digital Health (Healthcare IT) Funding and M&A Report also contains year-over-year (YoY) and quarter-over-quarter (QoQ) information on market activity displayed in easy-to-digest charts, graphs and tables, as well as data-driven analysis covering:
- Venture capital (VC) funding deals, including top investors, QoQ trends, and charts and graphs broken down by technology and stage;
- Practice-focused technology and subgroups;
- Consumer-focused technology and subgroups;
- VC funding by country and U.S. state;
- VC funding trends in early stage deals (below $2 million) and trends in deals over $2 million;
- Debt and public market financing deals;
- Mergers and acquisitions (M&A), including QoQ trends, a breakdown of charts and graphs by technology and geography;
- New Healthcare IT funds
This report also contains comprehensive lists of all announced Q1 2020:
- VC deals with investors and transaction details;
- Debt and public market financing deals and investors;
- M&A transactions and acquirers.
This report is 93 pages in length, contains 58 charts, graphs and tables, and covers 657 investors and companies.
RELATED PRODUCTS
Other reports you may be interested in
Venture Capital Funding
in Digital Health Sector
Reaches $15 Billion in 1H 2021
Venture Capital Funding
in Digital Health Sector
Reaches $7.2 Billion in Q1 2021
Bundle and Save ~20%
Get Quarterly Reports + The Annual Wrap
- Claim Your Deal!
Venture Capital Funding
in Digital Health Sector
Reaches $14.8 Billion in 2020
Digital Health VC Funding Hits
$10.3 Billion in 9M 2020
- Get the Details!
Digital Health/Healthcare IT VC Funding Hits
$6.3 Billion in 1H 2020
- Get the Details!
Bundle and Save ~20%
Get Quarterly Reports + The Annual Wrap
- Claim Your Deal!
Venture Capital Funding
in Digital Health Sector
Reaches $8.9 Billion in 2019
Digital Health VC Funding Hits
$7.2 Billion in 9M 2019
- Get the Details!
Bundle and Save ~20%
Get Quarterly Reports + The Annual Wrap
- Claim Your Deal!