

Q4 and Annual 2019 Digital Health (Healthcare IT) Funding and M&A Report
Price range: $599.00 through $999.00
Venture Capital Funding
in Digital Health Sector
Reaches $8.9 Billion in 2019
Click here to download the Executive Summary.
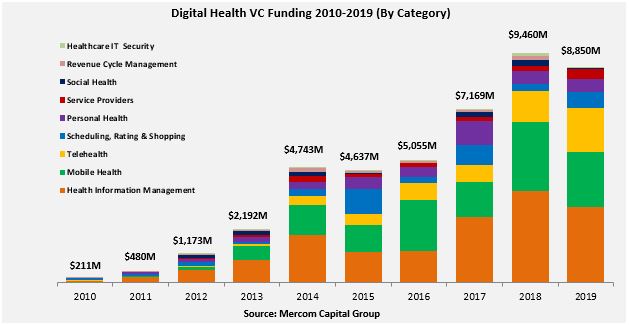
The report covers both consumer-centric and patient-centric technologies and sub-technologies, including: Social Health, Mobile Health (mHealth), Telehealth, Personal Health, Rating & Shopping, Health Information Management, Revenue Cycle Management, Service Providers and Security. Click here to see our complete list of technologies.
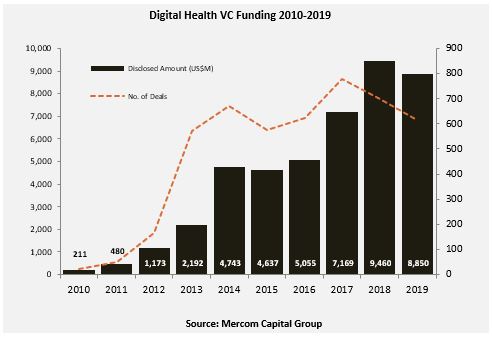
Global venture capital (VC) funding in digital health, including private equity and corporate venture capital, declined in 2019 with $8.9 billion raised in 615 deals, a 6% drop compared to $9.5 billion in 698 deals in 2018. Total corporate funding for Digital Health companies – including VC, debt, and public market financing – reached $10.1 billion in 2019.
Since 2010, Digital Health companies have received $44 billion in VC funding in over 4,500 deals and almost $14 billion in debt and public market financing (including IPOs), bringing the cumulative investments into the sector to $58 billion.
“After three consecutive years of growth, venture deals, and dollars for digital health companies declined in 2019. After a long dry spell, there were four U.S. IPOs, but their performance so far has been underwhelming. M&A activity also declined in 2019. The big winners were telemedicine companies, with a 55% percent increase in funding YoY while digital health products that were powered by AI, brought in over $2 billion,” said Raj Prabhu, CEO of Mercom Capital Group.
Consumer-centric companies brought in $5.3 billion in 354 deals in 2019, up just 2% from $5.2 billion raised in 447 deals in 2018. Practice-centric companies raised close to $3.6 billion in 261 deals in 2019, a 16% decrease compared to the $4.3 billion in 251 deals in 2018.
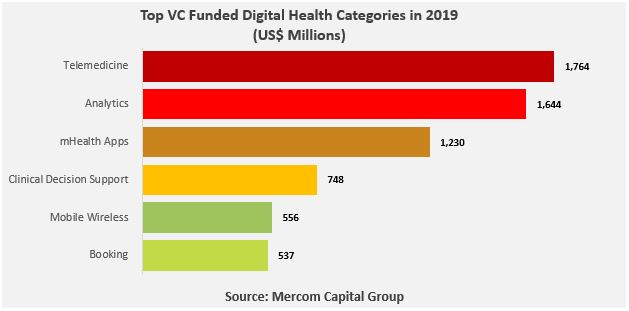
The top funded categories in 2019 included: Telemedicine with $1.8 billion, closely followed by Data Analytics with $1.6 billion, mHealth Apps with $1.2 billion, Clinical Decision Support with $748 million, Mobile Wireless Technology with $556 million, and Booking with $537 million.
There were 169 M&A transactions in 2019 compared to the 223 transactions in 2018, a 24% decline in deal activity. Nineteen companies participated in multiple transactions in 2019.
mHealth Apps were the most acquired category in 2019 with 27 transactions, followed by Practice Management Solutions with 17 transactions, and Telemedicine with 14 transactions.
The top five disclosed M&A transactions in 2019 were: Dassault Systemes’s acquisition of Medidata for $5.8 billion, EQT VIII Fund (EQT) and Canada Pension Plan Investment Board (CPPIB), which acquired a majority stake in Waystar for $2.7 billion, Google’s acquisition of Fitbit for $2.1 billion, Golden Gate Capital’s acquisition of Ensemble Health Partners (51% stake) for $1.2 billion, Agfa-Gevaert Group’s acquisition of Dedalus Holding for $1.07 billion, and Baring Private Equity Asia’s acquisition of healthcare IT consulting company, CitiusTech, for $1 billion.
The Q4 and Annual 2019 Digital Health (Healthcare IT) Funding and M&A Report also contains year-over-year (YoY) and quarter-over-quarter (QoQ) information on market activity displayed in easy-to-digest charts, graphs and tables, as well as data-driven analysis covering:
- Venture capital (VC) funding deals, including top investors, QoQ trends, and charts and graphs broken down by technology and stage;
- Practice-focused technology and subgroups;
- Consumer-focused technology and subgroups;
- VC funding by country and U.S. state;
- VC funding trends in early stage deals (below $2 million) and trends in deals over $2 million;
- Debt and public market financing deals;
- Mergers and acquisitions (M&A), including QoQ trends, a breakdown of charts and graphs by technology and geography;
- New Healthcare IT funds
This report also contains comprehensive lists of all announced Q4 2019:
- VC deals with investors and transaction details;
- Debt and public market financing deals and investors;
- M&A transactions and acquirers.
This report is 136 pages in length, contains 110 charts, graphs and tables, and covers 580 investors and companies.
RELATED PRODUCTS
Other reports you may be interested in
Venture Capital Funding
in Digital Health Sector
Reaches $15 Billion in 1H 2021
Venture Capital Funding
in Digital Health Sector
Reaches $7.2 Billion in Q1 2021
Bundle and Save ~20%
Get Quarterly Reports + The Annual Wrap
- Claim Your Deal!
Venture Capital Funding
in Digital Health Sector
Reaches $14.8 Billion in 2020
Digital Health VC Funding Hits
$10.3 Billion in 9M 2020
- Get the Details!
Digital Health/Healthcare IT VC Funding Hits
$6.3 Billion in 1H 2020
- Get the Details!
Bundle and Save ~20%
Get Quarterly Reports + The Annual Wrap
- Claim Your Deal!
Venture Capital Funding
in Digital Health Sector
Reaches $3.6 Billion in Q1 2020
Digital Health VC Funding Hits
$7.2 Billion in 9M 2019
- Get the Details!
Bundle and Save ~20%
Get Quarterly Reports + The Annual Wrap
- Claim Your Deal!