
Investors in the PV solar industry have worked to properly understand and price their solar projects, and thus determine the return on their investments. The PV solar industry has responded by moving the pricing discussion from a capacity basis to an energy generation basis. IE they have moved from a cost per watt conversation to a cost per kilowatt-hour. The cost of this energy generation is usually represented by an estimated “levelized cost of electricity” or “LCOE”. Yet, since the real purpose of the LCOE is to help price projects, it helps to be clear on what assumptions to have built into your LCOE. Otherwise, you may not have properly calculated your cost versus revenues or understood the magnitude of the margin of error in the LCOE estimate. And this will not just damage your portfolio – it will damage your reputation.
Levelized Cost of Electricity Formulas: Fancy Formulas for Simple Summations
In order to understand your LCOE, it is always a good idea to go back to basics. The basic formula to determine your LCOE starts with equating your costs and revenues. This can be represented in the simple formula below.
- Cost structure = electricity output * cost of electricity
Therefore the cost of the electricity of your LCOE can be defined as:
- LCOE = (Cost Structure / Electricity Output)
Now let us clarify what is in the denominator and in the numerator. Don’t get scared by the following formulas. All they really show is that you have additions over time. Then you factor the time period by bringing it to the present value – that is what these slightly fancy equations are meant to show you: 
Your cost structure is defined as incorporating your project cost plus the present value of your annual operations (AO) expenditures and subtracting the present value of any residual value (RV) for the solar system, all of this based on your discount rate (DR).

Your electricity output would be defined as the present value of the kilowatt hours of your system based on the insolation of your region and the thermal and the DC-to-AC derating of your specific system multiplied by the expected annual degradation of your system. If you want to get really fancy you can factor in an uptime factor to reflect your assumptions on what fraction of the time your system is actually “up” and generating electricity.
It is important to have these two elements clearly defined, since this is where most of the assumptions that sales and marketing personnel make are incorporated. Or as the case may be – not incorporated. Let us look at 2 examples of LCOE formulas and the estimates you get from these formulas.
Basic LCOE Formula
Starting from our defined elements, we can translate all this into a formula so that we can calculate our cost of electricity:

This looks pretty straightforward and you can construct a straightforward spreadsheet model to calculate it.
Leveraged LCOE Formula
Yet it is too simple. For example, does the annual cost incorporate anything beyond maintenance and monitoring? Is insurance included? Does it contain a factor for eventual inverter replacement cost? What about the financial and tax factors such as depreciation, interest?
Thus we can take the basic calculation and make it a bit more complex by addition these factors and you get the following formula that we used to build our spreadsheet: 
| LCOE = Levelized Cost of Electricity | AO = Annual operations costs | DEP = Depreciation |
| PCI = Project Cost minus Investment Tax Credit | RV = Residual Value | LP = Loan Payment |
| DR = Discount Rate | INT = Interest Paid | |
| TR = Tax Rate | N = Number of years for system |
Now your cost structure incorporates your cost after the investment tax grant minus the present value of your residual value plus the present value of several factors. These factors include subtracting the tax benefit of your depreciation, adding the loan payment if you finance part of your system, subtracting the tax benefit of your interest, and finally factoring in all your annual costs after you account for the tax benefit they provide you. We would still use the same electricity output formula.
Case Study: Proposed Plant for Austin Energy
So far all of this has been a rather academic exercise. It is a bit more interesting if you start to use some of the proposed projects out there and figure out the potential LCOE of a system. What we will show next is an analysis that we have done of the project Gemini and Austin Energy are working on. Figure 1. Assumptions for the analysis of a PV System in Webberville, Texas.
Assumptions
- 30 MW AC System – derated to 35 MW DC
- Installed system cost – $4/w for a total of $141 million
- 30% tax grant cuts costs to $99 million
- Tax benefits based on 30% tax rate
- Single Axis Trackers
- Austin Energy provides land
- O&M cost – $4.6/panel (includes insurance) with a 4% cost escalator
- Discount rate – 8.1%
- Solar RECs sold at $15/MW
- Sunlight hours / year – 2000
- Initial KWh per year – 60 million
- Annual degradation – 0.5%
Figure 1 Source: Estimates by solarconsultingcenter.com. Please note that these are our assumptions and should not be considered to be data from the firms referenced.
Calculating the estimated LCOE for this installation based on our assumptions we get two results:
- Basic Model: $0.12 per kWh
- Leveraged Model: $0.08 per kWh
This gives you an idea of how broad the range can be for estimates on LCOE. This can be further tweaked by the modeler based on the factors they have incorporated into the model. In particular, if they are optimistic and use ideal conditions of insolation, uptime and limited degradation, you can get very low estimates that may not align with reality. Keep in mind the following things based on this analysis:
- Depending on the formula you pick, you can get a broad range of LCOE estimates
- Your starting assumptions are hugely critical factors for your LCOE estimates
- You do not get the margin of error for the LCOE estimate from this formula
- Most importantly – this is just an estimate
Sensitivity Analysis of this Case Study
A simple sensitivity analysis strongly reinforces the central point that this is an estimate. Keep in mind for this graphical analysis is that some things you can control and some things you cannot. Below we have the leveraged LCOE for a scenario where you control the factors – IE the price you pay for a system, and then 2 scenarios where you only have limited control – IE system performance in the field. Figure 2. Leveraged LCOE Sensitivity Analysis for Three PV System Factors
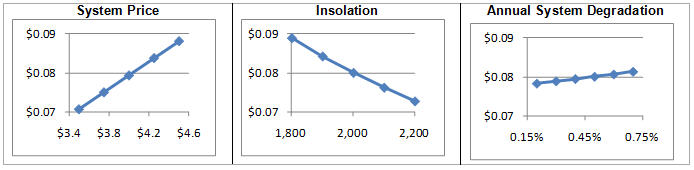
Source: Estimates by solarconsultingcenter.com. Please note that these are our assumptions and should not be considered to be data from the firms referenced. Also note that Leveraged LCOE is charted on the y-axis with a range of $0.07 to $0.09 per kWh.
The first graph of Figure 2 is pretty straightforward. Assuming that the quality of the PV system is the same for all cases, the LCOE should decrease as system cost decreases.
The next two graphs start to show us some of the complications for the LCOE analysis. For higher insolations, you get more electricity output so your LCOE will be lower. For higher levels of panel degradation, you will get less electricity output and thus a higher LCOE.
The insolation of any particular site should average out to a steady state over the long term. Yet in the short term, you can get very significant variations that can affect your energy output and thus your revenue stream. They may not be as extreme as these show on the second graph, but you will need to consider it. The commercial activity in your neighborhood may end up throwing extra dirt or soot on your system and impairing its performance. Panel mismatches may drag down the output of your system. Plus your panels may have a sharp degradation spike in the first year or two of performance, with a low degradation in the out years. Operations, maintenance and monitoring are critical for ensuring your LCOE is tracking your estimates.
Again, this is a simple analysis that does not capture the reality in field. But then – an LCOE estimate is based on a simplified set of factors.
Conclusion – Beware the Assumptions in the PV Industry
In today’s PV market, everyone you talk to tells you stories based on their LCOE. System owners brag about their LCOE. Start-up thin-film PV firms and microinverter firms will tell you about their calculated LCOE. When you hear them, you need to ask yourself:
- What assumptions did they factor in and what did they exclude?
- Did they factor in all the degradation / uptime /other issues?
- Are they dealing with real or nominal dollars?
- Do you want to factor in the sale of s-RECs as part of the calculation of your LCOE, or just factor it in afterwards in your ROI analysis?
- What is the margin of error of this estimate?
Your due diligence on any project should include an analysis of both the cost of the capacity – IE the cost per watt peak for the installed system – and the cost of the energy output – IE the LCOE of the system.
Revisit the assumptions for the LCOE of any PV solar project you look at. Any of the formulas for calculating LCOE are useful since they help you compare your system to other PV systems as well as average utility rates. For example, the basic formula may apply if you have sold all your tax benefits to investors and just want to deal with nominal 2010 dollars. After all, you can subtract the sale of the tax benefits from your cost and proceed with your analysis.
Once you take the time to properly factor the assumptions built into a vendor’s or investor’s LCOE estimates, you can start to parse the risks on the rate of return for a project, and how realistic the assumptions were. And this is the most critical step you can take to maintain your reputation.