

Q4 and Annual 2020 Digital Health (Healthcare IT) Funding and M&A Report
$599.00 – $999.00
Venture Capital Funding
in Digital Health Sector
Reaches $14.8 Billion in 2020
Click here to download the Executive Summary.
The report covers both consumer-centric and patient-centric technologies and sub-technologies, including: Social Health, Mobile Health (mHealth), Telehealth, Personal Health, Rating & Shopping, Health Information Management, Revenue Cycle Management, Service Providers and Security.
Click to see the complete list of technologies covered in this report.
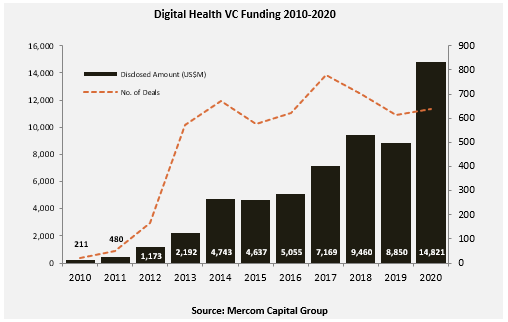
Global venture capital (VC) funding in Digital Health, including private equity and corporate venture capital, came to $14.8 billion in 637 deals, a 66% increase compared to $8.9 billion in 615 deals in 2019. Total corporate funding for Digital Health companies – including VC, debt, and public market financing – reached $21.6 billion in 2020.
Since 2010, Digital Health companies have received $59 billion in VC funding in over 5,000 deals and almost $21 billion in debt and public market financing (including IPOs), bringing cumulative investments into the sector to approximately $80 billion.
“COVID-19 supercharged funding activity in digital health in 2020. Ten digital health categories had their best year with record funding amounts. It was also the biggest year for IPOs with six digital health companies raising over $6 billion. We could see a lot more companies going public in 2021 if the current IPO and SPAC boom continues,” commented Raj Prabhu, CEO of Mercom Capital Group. “The pandemic has mainstreamed the consumer side of digital health technologies in less than a year. Digital health products that were a novelty a year or two ago are now a necessity.”
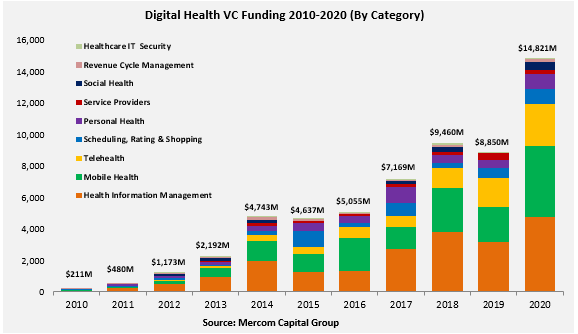
Consumer-centric companies brought in $9.6 billion in 2020, up 81% YoY. Practice-centric companies raised $5.3 billion a 47% increase compared to 2019.
In 2020, Telemedicine was the top funded category and led VC funding activity with $4.3 billion, a 139% YoY increase compared to $1.8 billion in 2019.
Other top-funded categories in 2020 included: Data Analytics with $1.8 billion, mHealth Apps with $1.4 billion, Clinical Decision Support with $1.2 billion, Practice Management Solutions with $837 million, Wearable Sensors with $815 million, Wellness with $792 million, Healthcare Booking with $765 million, and Social Health Networks with $500 million.

There were 184 M&A transactions in 2020 compared to 169 in 2019, a nine percent increase in deal activity. Eighteen companies participated in multiple transactions in 2020.
Practice Management Solutions companies led M&A activity with 25 transactions, followed by Telemedicine companies with 23 transactions, mHealth App companies with 19 transactions, and Data Analytic companies with 18 transactions.
The top five disclosed M&A transactions in 2020 were: Teladoc’s acquisition of Livongo Health for $18.5 billion, Blackstone’s acquisition of a majority stake in Ancestry for $4.7 billion, Philips’ acquisition of BioTelemetry for $2.8 billion, Invitae’s acquisition of ArcherDX for $1.4 billion, and WellSky’s acquisition of Allscripts’s CarePort Health (CarePort) business, for $1.35 billion.
The Q4 and Annual 2020 Digital Health (Healthcare IT) Funding and M&A Report also contans year-over-year (YoY) and quarter-over-quarter (QoQ) information on market activity displayed in easy-to-digest charts, graphs and tables, as well as data-driven analysis covering:
- Venture capital (VC) funding deals, including top investors, QoQ trends, and charts and graphs broken down by technology and stage;
- Practice-focused technology and subgroups;
- Consumer-focused technology and subgroups;
- VC funding by country and U.S. state;
- VC funding trends in early stage deals (below $2 million) and trends in deals over $2 million;
- Debt and public market financing deals;
- Mergers and acquisitions (M&A), including QoQ trends, a breakdown of charts and graphs by technology and geography;
- New Healthcare IT funds
This report also contains comprehensive lists of all announced Q4 2020:
- VC deals with investors and transaction details;
- Debt and public market financing deals and investors;
- M&A transactions and acquirers.
This report is 144 pages in length, contains 110 charts, graphs and tables, and covers 736 investors and companies.
RELATED PRODUCTS
Other reports you may be interested in
Venture Capital Funding
in Digital Health Sector
Reaches $15 Billion in 1H 2021
Venture Capital Funding
in Digital Health Sector
Reaches $7.2 Billion in Q1 2021
Bundle and Save ~20%
Get Quarterly Reports + The Annual Wrap
- Claim Your Deal!
Digital Health VC Funding Hits
$10.3 Billion in 9M 2020
- Get the Details!
Digital Health/Healthcare IT VC Funding Hits
$6.3 Billion in 1H 2020
- Get the Details!
Bundle and Save ~20%
Get Quarterly Reports + The Annual Wrap
- Claim Your Deal!