

9M and Q3 2020 Digital Health (Healthcare IT) Funding and M&A Report
Price range: $299.00 through $549.00
Digital Health VC Funding Hits
$10.3 Billion in 9M 2020
– Get the Details!
Click here to download the Executive Summary.
The report covers both consumer-centric and patient-centric technologies and sub-technologies, including: Social Health, Mobile Health (mHealth), Telehealth, Personal Health, Rating & Shopping, Health Information Management, Revenue Cycle Management, Service Providers and Security. Click here to see our complete list of technologies.
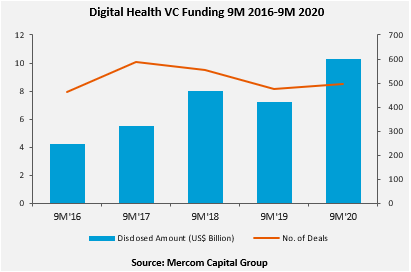
Global VC funding for Digital Health companies in the first nine months (9M) of 2020 broke all previous 9M funding records, bringing in $10.3 billion. Funding activity was up by 43% during 9M 2020 compared to $7.2 billion raised in 9M 2019. Digital Health companies raised $4 billion in VC funding in 195 deals during Q3 2020 compared to $2.8 billion in 161 deals in Q2 2020, also a 43% increase quarter-over-quarter (QoQ). Year-over-year (YoY), VC funding was up by 100% compared to $2 billion in 155 deals in Q3 2019.
“Digital health and especially telehealth, has taken off amid COVID-19 and VC funding has already surpassed funding raised in any full year to date. There were five IPOs in digital health, which is unprecedented and we also had one of the biggest M&A deals in digital health history in the third quarter,” said Raj Prabhu, CEO of Mercom Capital Group.
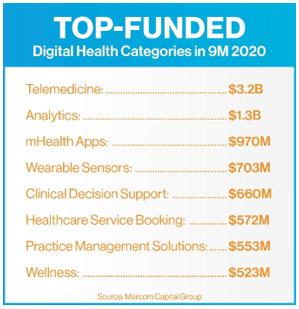
The top-funded categories in 9M 2020 were: Telemedicine with $3.2 billion, followed by Data Analytics with $1.3 billion, mHealth Apps with $970 million, Wearable Sensors with $703 million, Clinical Decision Support with $660 million, Healthcare Service Booking with $572 million, Practice Management Solutions with $553 million, and Wellness with $523 million.
Early round venture capital funding (Seed, Series A) came to $1.2 billion. Most of the early round VC funding in 9M 2020 went to Telemedicine, mHealth Apps, Data Analytics, Wellness, and Clinical Decision Support companies.
A total of 601 investors participated in funding deals in Q3 2020, compared to 488 investors in Q2 2020.
General Catalyst, Initialized Capital, Oak HC/FT, Techstars Ventures, and YCombinator led Digital Health financing activity during Q3 2020, with each investing in four rounds.
A record 1,522 investors participated in 9M 2020 compared to 1,171 investors in 9M 2019.
In 9M 2020, a total of 132 Digital Health M&A transactions were announced compared to 125 in 9M 2019. In Q3 2020, there were 49 M&A transactions compared to 34 in Q3 2019.
Notable M&A transactions in 9M 2020: Teladoc Health acquired Livongo Health for $18.5 billion, Blackstone acquired Ancestry for $4.7 billion, Invitae acquired ArcherDX for $1.4 billion, Healthcare Merger Corporation acquired Specialists On Call (dba SOC Telemed) for $720 million, and Teladoc Health acquired InTouch Health for $600 million.
A total of 892 companies and investors were covered in this report.
The 9M and Q3 2020 Digital Health (Healthcare IT) Funding and M&A Report contains annual, quarter-over-quarter (QoQ) information on market activity displayed in easy-to-digest charts, graphs and tables, as well as data-driven analysis covering:
- Venture capital (VC) funding deals, including top investors, QoQ trends, and charts and graphs broken down by technology and stage;
- Practice-focused technology and subgroups;
- Consumer-focused technology and subgroups;
- VC funding by country and U.S. state;
- VC funding trends in early stage deals (below $2 million) and trends in deals over $2 million;
- Debt and public market financing deals;
- Mergers and acquisitions (M&A), including QoQ trends, a breakdown of charts and graphs by technology and geography;
- New Healthcare IT funds
- Half-year trends and analysis
This report also contains comprehensive lists of all announced Q3:
- VC deals with investors and transaction details;
- Debt and public market financing deals and investors;
- M&A transactions and acquirers.
This report is 115 pages in length, contains 67 charts, graphs, and tables, and covers 892 investors and companies.
RELATED PRODUCTS
Other reports you may be interested in
Venture Capital Funding
in Digital Health Sector
Reaches $15 Billion in 1H 2021
Venture Capital Funding
in Digital Health Sector
Reaches $7.2 Billion in Q1 2021
Bundle and Save ~20%
Get Quarterly Reports + The Annual Wrap
- Claim Your Deal!
Venture Capital Funding
in Digital Health Sector
Reaches $14.8 Billion in 2020
Digital Health/Healthcare IT VC Funding Hits
$6.3 Billion in 1H 2020
- Get the Details!
Bundle and Save ~20%
Get Quarterly Reports + The Annual Wrap
- Claim Your Deal!