

1H and Q2 2020 Digital Health (Healthcare IT) Funding and M&A Report
Price range: $299.00 through $549.00
Digital Health/Healthcare IT VC Funding Hits
$6.3 Billion in 1H 2020
– Get the Details!
Click here to download the Executive Summary.
The report covers both consumer-centric and patient-centric technologies and sub-technologies, including: Social Health, Mobile Health (mHealth), Telehealth, Personal Health, Rating & Shopping, Health Information Management, Revenue Cycle Management, Service Providers and Security. Click here to see our complete list of technologies.
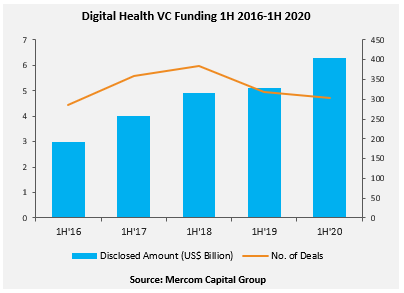
Global VC funding for Digital Health companies in the first half (1H) of 2020 shattered all previous 1H funding records, bringing in $6.3 billion. Funding activity was up by 24% during 1H 2020, compared to $5.1 billion raised in 1H 2019. However, in Q2 2020, Digital Health companies raised $2.8 billion in 161 deals, a 23% decrease compared to Q1 2020. Year-over-year, funding was down by 11% compared to $3.1 billion in 169 deals in Q2 2019.
“Seen as a solution to many of the health challenges resulting from the COVID-19 pandemic, several digital health technologies and services have gone mainstream. Investors have noticed the potential, and Telehealth has been the biggest beneficiary and has received almost $2 billion in the 1H. mHealth apps and data analytics companies have also benefitted. Digital Heath companies had their best fundraising first half ever and have now raised $50 billion venture funding in over 5,000 deals since 2010,” said Raj Prabhu, CEO of Mercom Capital Group.
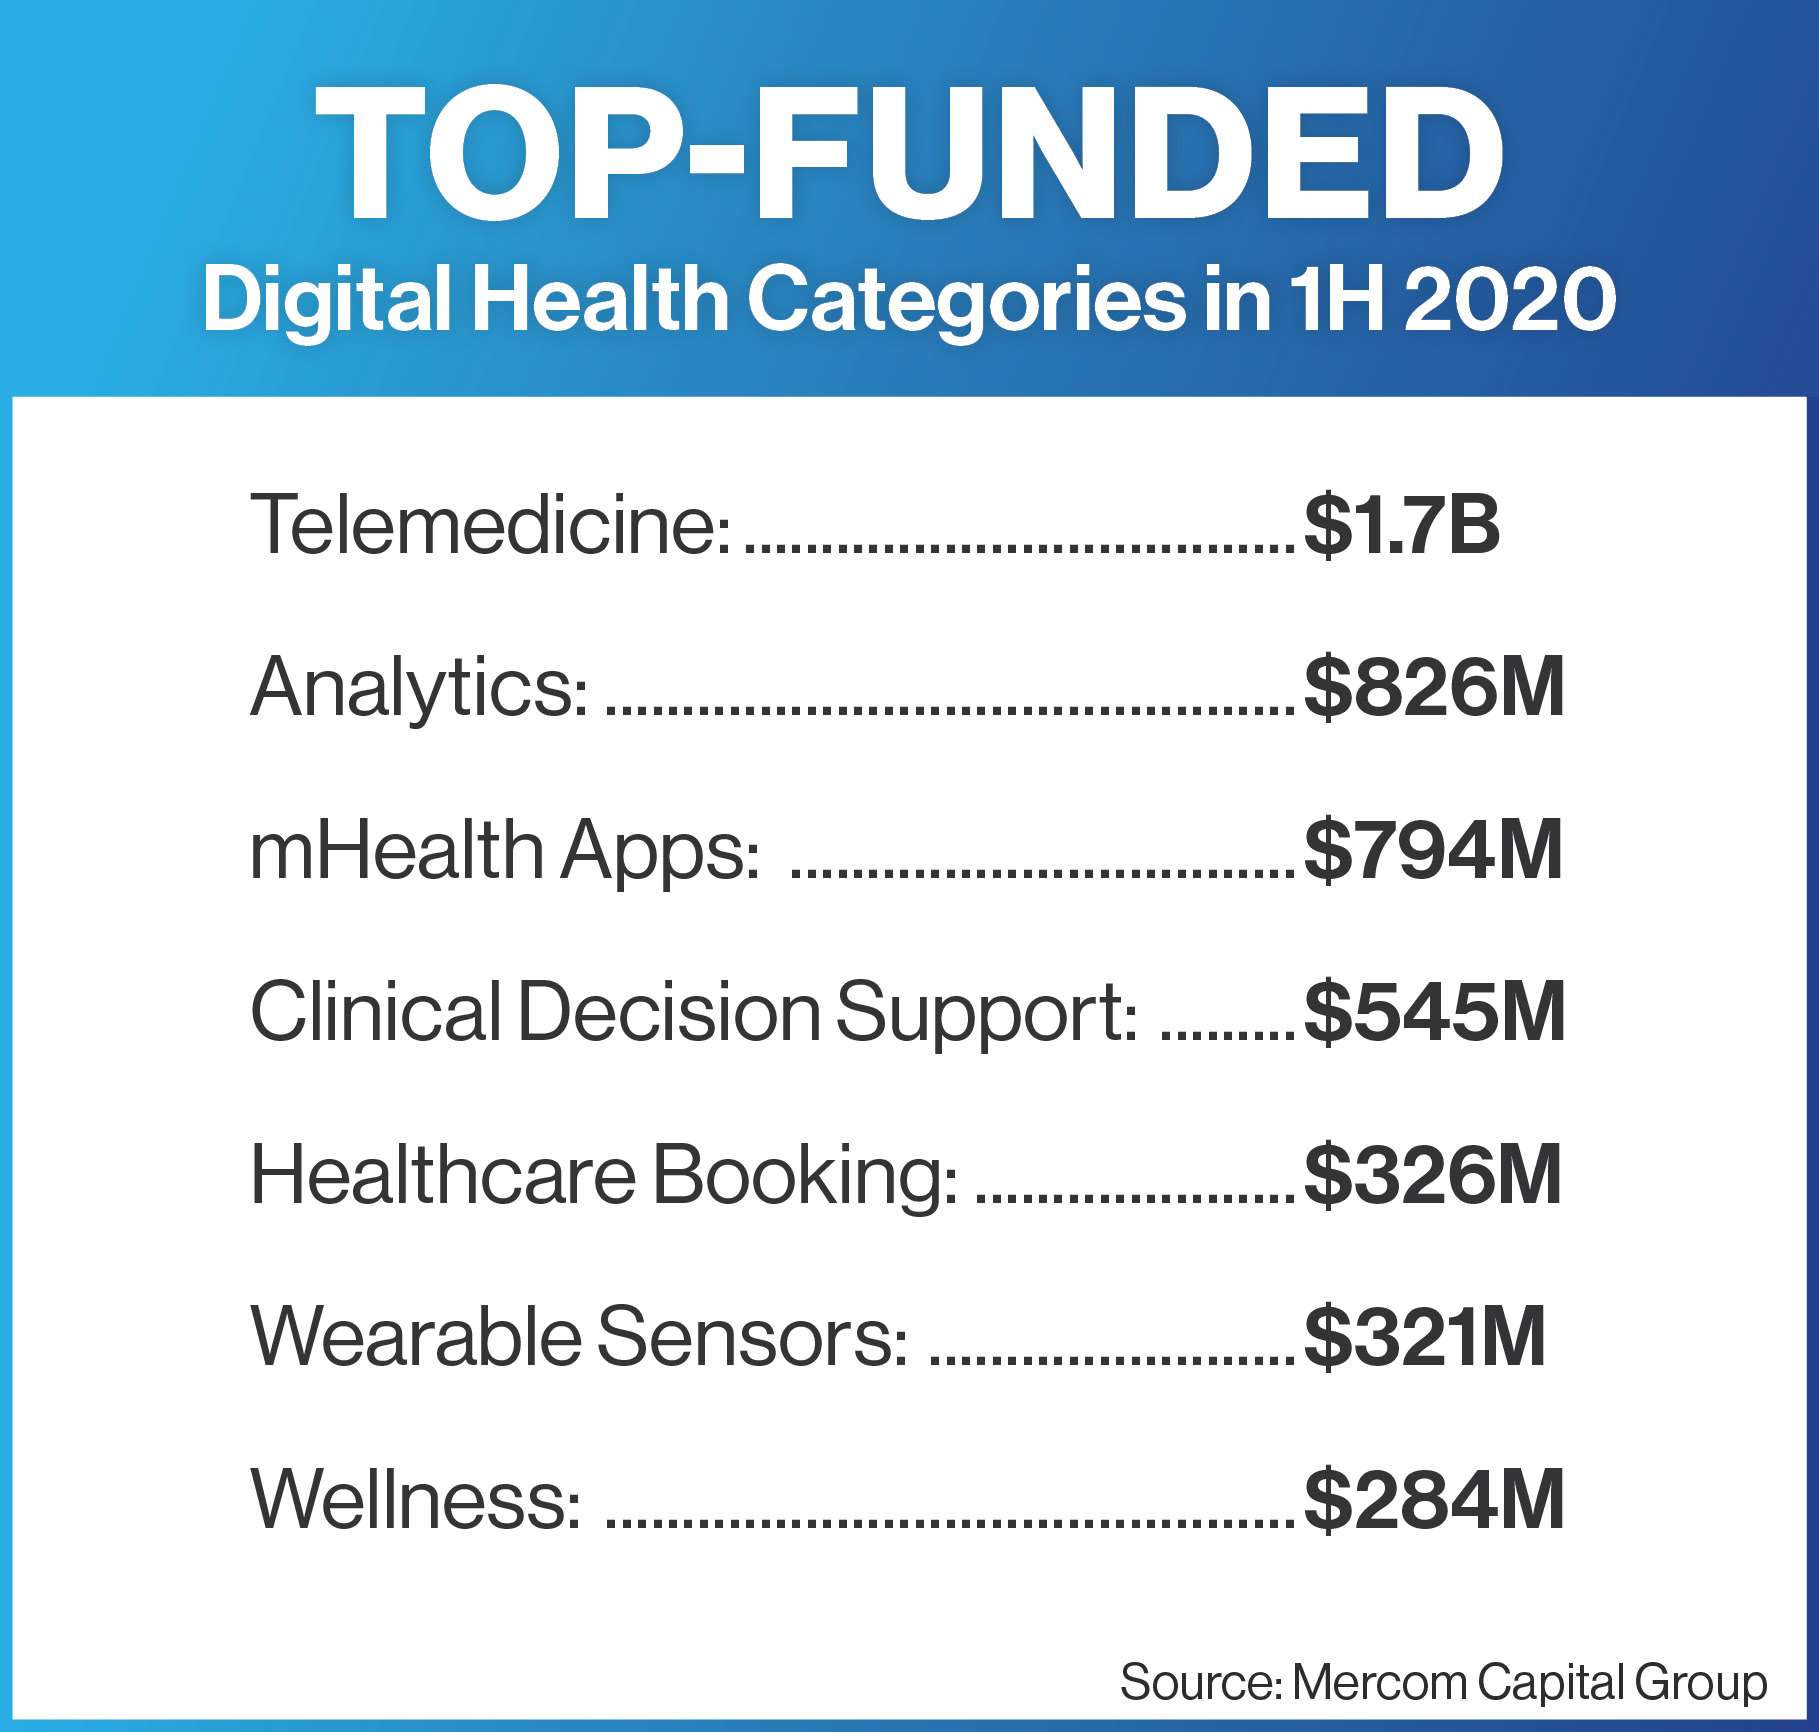
The top-funded categories in 1H 2020 were: Telemedicine with $1.7 billion, Analytics with $826 million, mHealth Apps with $794 million, and Clinical Decision Support with $545 million.
Early round venture capital funding (Seed, Series A) came to $690 million. Most of the VC funding in early rounds in 1H 2020 went to Telemedicine, mHealth Apps, Data Analytics, and Clinical Decision Support companies.
Four hundred and eighty-eight investors participated in funding deals in Q2 2020, compared to 433 investors in Q1 2020. Optum Ventures led Digital Health financing activity during Q2 with six investments. Seedcamp and Y Combinator each made four investments, and another 31 investors made two or more investments during Q2 2020.
A record 921 investors participated in 1H 2020, compared to 821 investors in 1H 2019. This is the largest number of investor participation in 1H since 2010.
In 1H 2020, a total of 83 Digital Health M&A transactions were announced compared to 91 in 1H 2019. In Q2 2020, there were 42 M&A transactions compared to 46 M&A transactions in Q2 2019.
Notable M&A transactions in 1H 2020 were: the acquisition of ArcherDX by Invitae for $1.4 billion, Teladoc Health’s acquisition of InTouch Health for $600 million, lululemon athletica’s acquisition of MIRROR for $500 million. AMN Healthcare acquired Stratus Video for $475 million, and CompuGroup Medical acquired Cerner’s assets in Germany and Spain for $248 million.
A total of 731 companies and investors were covered in this report.
The 1H andQ2 2020 Digital Health (Healthcare IT) Funding and M&A Reportcontains annual, quarter-over-quarter (QoQ) information on market activity displayed in easy-to-digest charts, graphs and tables, as well as data-driven analysis covering:
- Venture capital (VC) funding deals, including top investors, QoQ trends, and charts and graphs broken down by technology and stage;
- Practice-focused technology and subgroups;
- Consumer-focused technology and subgroups;
- VC funding by country and U.S. state;
- VC funding trends in early stage deals (below $2 million) and trends in deals over $2 million;
- Debt and public market financing deals;
- Mergers and acquisitions (M&A), including QoQ trends, a breakdown of charts and graphs by technology and geography;
- New Healthcare IT funds
- Half-year trends and analysis
This report also contains comprehensive lists of all announced Q2:
- VC deals with investors and transaction details;
- Debt and public market financing deals and investors;
- M&A transactions and acquirers.
This report is 100 pages in length, contains 69 charts, graphs and tables, and covers 731 investors and companies.
RELATED PRODUCTS
Other reports you may be interested in
Venture Capital Funding
in Digital Health Sector
Reaches $15 Billion in 1H 2021
Venture Capital Funding
in Digital Health Sector
Reaches $7.2 Billion in Q1 2021
Bundle and Save ~20%
Get Quarterly Reports + The Annual Wrap
- Claim Your Deal!
Venture Capital Funding
in Digital Health Sector
Reaches $14.8 Billion in 2020
Digital Health VC Funding Hits
$10.3 Billion in 9M 2020
- Get the Details!
Bundle and Save ~20%
Get Quarterly Reports + The Annual Wrap
- Claim Your Deal!