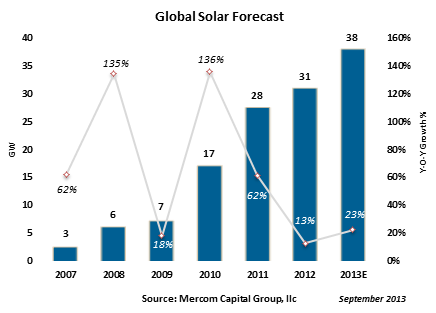
After years of overcapacity, bankruptcies and record low prices we are now seeing price stabilization, higher capacity utilization rates and a move towards supply-demand equilibrium. Market conditions for solar look much better than they did just three months ago and we are reiterating our global installation forecast of ~38 GW for 2013.
One of the big overhangs, the China-EU trade case, has been settled, which could have otherwise set off an all-out trade war. This brings some sorely needed certainty to the market. A rate of €0.56 (~$0.74) per watt was the agreed upon pricing for Chinese panels coming into the EU. Under the settlement terms China will be allowed to meet half of Europe’s panel demand (7 GW) without being subject to tariffs. China, on the other hand imposed antidumping duties on the U.S. and South Korean polysilicon manufacturers, but not on polysilicon from the EU. Although trade skirmishes will likely continue, this settlement is a relief for the markets.
China and Japan are installing at a rapid pace and making all the right moves in terms of policy to give some confidence to the market that they are ready to take over as top solar markets for some time to come.
The Chinese State Council has once again raised solar installation targets with the new goal of installing 35 GW by 2015, up from 21 GW. China’s push towards stronger domestic demand is primarily driven by necessity – to help domestic manufacturing and address air pollution problems. It would have been inconceivable just a few years ago to think that China would look to solar as a solution to its unprecedented environmental problems. That is precisely what is happening now. Strong domestic consumption gives the Chinese solar market which has been known mainly for low cost manufacturing destination some credibility.
In a move to diversify its energy generation sources after the Fukushima disaster, Japan announced policies to aggressively promote renewable energy. Japan now has one of the most generous solar tariffs in the world at ~¥37.8 (~$0.38)/kWh which is driving installations. The Agency for Natural Resources and Energy (ANRE) has reported that Japan added 1,240 MW in solar installations in just two months, April and May. While Ministry of Economy, Trade, and Industry (METI) reports that it has approved over 19 GW of PV project applications under its FiT scheme, about 16 GW of those were approved in the 2013 calendar year.
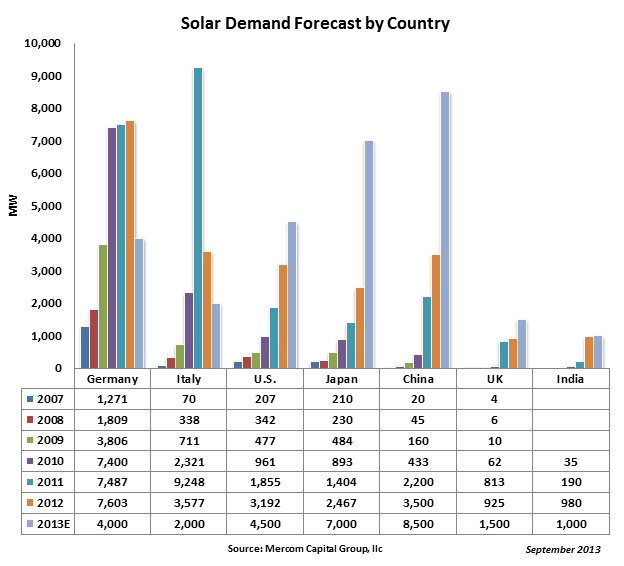
With a 2013 forecast of 8.5 GW and 7 GW respectively, China and Japan are on pace to be the top installers this year. PV installations in the United States continue to grow and are forecasted to reach about 4.5 GW in 2013. Other major markets forecasted in 2013 are Germany at 4 GW, Italy at 2 GW, UK at 1.5 GW and India at 1 GW.
Germany
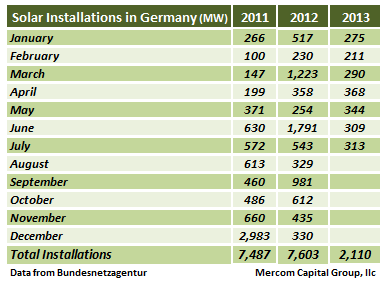
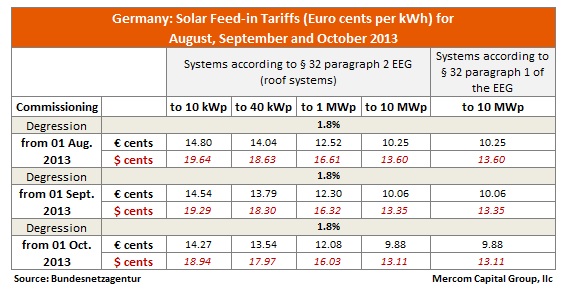
Germany has installed just 2.1 GW of PV as of July this year, compared to almost 4.4 GW installed in the same period last year. The digression formula adopted by the German Federal Network Agency (Bundesnetzagentur) of reducing tariffs by 1.8 percent every month seems to have had the intended effect of restricting annual installations to the desired 3.5 – 4 GW range. The Federal Network Agency has extended the same digression formula for the period of August – October 2013. German PV installations in 2012 were a record 7.6 GW, while cumulative PV installations in Germany are now at 34.5 GW as of July 2013. Germany has set a goal of subsidizing its solar program up to 52 GW. Germany will finally be giving up its leadership position as the top PV installer to either China or Japan this year.
Italy
Italy’s solar subsidy program, Conto Energia V, has come to an end as the annual cost of PV incentives paid out has almost reached the cap of €6.7B (~$8.8B) as of July 2013. Italy was the top PV installer in 2011 with installations of 9.2 GW. Italy’s cumulative PV installations exceed 17 GW and solar energy contributes to over 7 percent of the energy generation mix. Due to excellent solar isolation and high electricity costs most parts of Italy have reached grid parity. Italian projects have had one of the highest ROIs among developed solar markets. Without direct subsidies the markets will have to rely on incentives like net metering, rebates and PPAs. There are unofficial reports that the government is looking to overhaul renewable energy subsidies in the near term.
United Kingdom
The UK is on pace to install over 1 GW of solar in 2013.
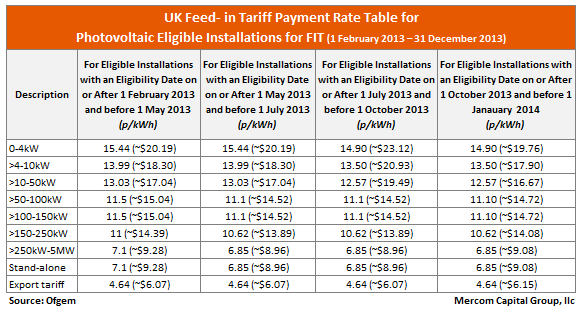
PV installations in the UK are driven by a feed-in-tariff program which is modeled similar to Germany’s. The FiT program uses digression to control the pace of installations at an optimal level. UK’s FiT’s are reviewed every three months, like Germany, and rates are adjusted based on capacity installed in the prior periods.
The UK FiT program has nine groups: 0-4 kW, 4-10 kW, 10-50 kW, 50-100 kW, 100-150 kW, 150-250 kW, 250 kW-5 MW, stand-alone, and an export rate category.
For the period starting July 1, 2013, tariffs ranged from ~£0.15 ($0.23)/kWh for 0-4 kW size installations to ~£0.05 ($0.09)/kWh for stand-alone installations.
United States
The United States continues to demonstrate strong growth with PV installations projected to be ~4.5 GW this year. U.S. PV installations were 3.2 GW in 2012 and 1.9 GW in 2011.
The United States solar market is driven by the 30 percent Federal Investment Tax Credit (ITC), which is valid until the end of 2016 along with State Renewable Portfolio Standards (RPS) and state and municipal rebate programs.
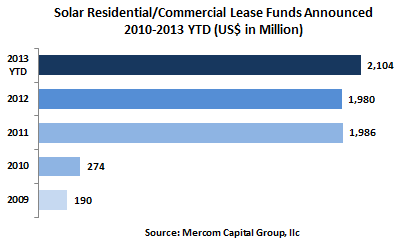
Some of the other factors driving installations are growth in utility-scale projects and distributed generation through third party financed residential and commercial installations. Solar lease programs, where consumers lease systems instead of making the upfront investment, are going main stream with over $2 billion raised in residential and commercial lease funds in 2012 and about $2.1 billion raised already in 2013. Several states with high retail electricity costs and high solar insolation have reached or are close to reaching grid parity. The Mercury and Air Toxics Standards (MATS), an EPA rule to reduce toxic air pollutants from new and existing coal and oil-fired power plants, is projected to force about 50-75 GW of coal power plants to retire by 2016 due to the high cost of compliance. Though natural gas will be the biggest beneficiary of this rule, it will also help drive solar and wind installations.
Japan
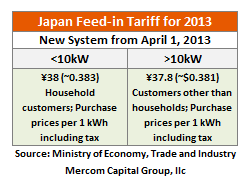
Spurred by generous tariffs, Japan is on course for a record year of PV installations, with a few teething problems. Japan decided to diversify its energy generation sources after the Fukushima disaster and announced policies to aggressively promote renewable energy. The Ministry of Economy, Trade, and Industry (METI) announced a FiT program in June 2012, with PV systems below 10 kW receiving ¥42/kWh (~$0.43) and systems above 10 kW receiving ¥40/kWh (~$0.51). METI then announced a 10 percent cut in tariffs to ~¥37.8/kWh (~$0.38) starting April 1, 2013, still making it one of the most generous tariffs around the world.
The Agency for Natural Resources and Energy (ANRE) has reported that Japan added 1,240 MW of solar installations in just two months, April and May. Of the over 19,000 MW of non-residential PV project applications that have been approved by METI under its FiT scheme, about 15,513 MW of those were approved in the 2013 calendar year. In an interesting development, new approvals have all but dried up since March 31, 2013, when the FiT changed from ¥42 (~$0.42)/kWh to ~¥37.8 (~$0.38)/kWh. Though the obvious reason for the drop seems to be the rush before the FiT cut, the cut itself is very small with the tariff still extremely generous. We have been talking about transmission bottlenecks in Japan for some time, but now grid connection issues are becoming more apparent.
Japan’s grid is monopolized by 10 operators who behave as 10 separate local grids with almost no interconnection. These grids were built to transmit power from large mega power plants and not for smaller renewable energy projects. Reports indicate that some of the PV projects are getting rejected citing overcapacity and grid stability issues. METI admits that some of the facilities approved have not begun construction and they are conducting a survey to find reasons behind the delays including whether there is a shortage of materials. The real reason may be all of the above, putting the burden on the Ministry and various utilities and agencies to come up with a long-term solution. It remains to be seen how serious these bottlenecks will be and how it will affect the installation forecast over the long term. Considering Japan is now forecasted as one of the top two solar markets in the world, any delays or slowdown will have an effect on the global solar supply chain.
Japan has set a goal of achieving 28 GW of cumulative PV installations by 2020.
China
As we previously reported, China’s push towards stronger domestic demand is primarily driven by the necessity to help its domestic manufacturing industry and solve its air pollution problem.
There are a lot of positive developments coming out of China that are good for the solar industry in general. The Chinese State Council has once again raised the solar installation targets with the new goal of installing 35 GW by 2015 or about 10 GW a year. This move to ramp up domestic consumption will help struggling local manufacturers. The Chinese State Council also announced several other measures such as controlling uninhibited capacity expansions, new efficiency standards of 20 percent for monocrystalline, 18 percent for polycrystalline and 12 percent for thin film that have to be met for new capacity addition, shutting down inefficient operations and incentivizing consolidation through tax breaks, and encouraging self-consumption among homeowners and businesses.
New tariffs for distributed solar projects, the first of its kind, were recently announced by The National Development and Reform Commission at a rate of 0.42 Yuan ($0.07)/kWh.
Encouraging still, is the strong push to address pollution problems prompted by growing public discontent. China recently launched its first of seven pilot emission trading schemes (ETS) with plans to expand nationally. Though there will be growing pains, this is a small but significant step towards a carbon or cap-and-trade market with a goal of reducing CO2 emissions by 40?45 percent by 2020 from its 2005 levels. The government has also mandated installation of equipment to remove nitrogen oxide from coal power plants and has promised severe punishment for failure to do so. Power plants will receive subsidies for installing the equipment and further incentives for coal power plants that upgrade their facilities to reduce pollution. A goal has also been set to reduce sulfur dioxide by 16 percent and nitrogen dioxide by 29 percent by 2013.
Overall there is generally a greater push and support for renewables and solar than ever before.
India
Indian solar installations have been driven by the Jawaharlal Nehru National Solar Mission (JNNSM) with a goal to install 20 GW of solar power by 2022, and various state policies and state RPOs.
There were a total of 622 MW of installations in India in the first seven months of 2013, with only 73 MW installed in the last three months
The decisions made by India to pursue anti-dumping investigations and domestic content requirements (DCR) have all but paralyzed the sector. The Indian economy continues to face challenges with slow growth, high interest rates and a weak rupee, making life harder for solar companies.
We are currently forecasting India to reach 1 GW in 2013, which is basically flat year over year.
A more detailed update on the Indian solar market can be found here.
This consensus forecast is based on Mercom’s views and methodology with data compiled from: BNEF, Credit Suisse, Deutsche Bank, Digitimes, EuPD, Fubon Research, GTM Research, HSBC, Hyundai, ICBC China, IHS iSuppli, IMS Research, KDB Daewoo, KGI, Macquarie Capital, Maxim Group, Mercom Capital Group, Mirae, Navigant Consulting, Piper Jaffray, Raymond James, Solarbuzz, Woori, Yuanta and other government, public and private sources.
Note: Dollar-rupee conversions were calculated at $1 = Rs.60. The Indian Rupee is trading at record lows.
Dollar-Euro conversions were calculated at $1 = 0.75
Dollar-Pound conversions were calculated at $1 = 0.64
Dollar-Yen conversions were calculated at $1 = 98.10
Dollar-Yuan conversions were calculated at $1 = 6.15

