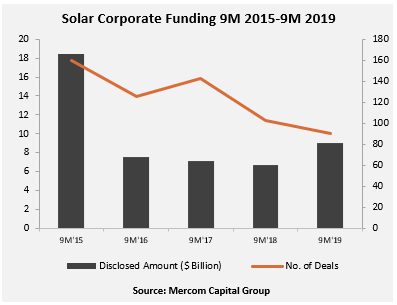
Total corporate funding (including venture capital/private equity, public market, and debt financing) in 9M 2019 was up with $9 billion raised, compared to the $6.7 billion raised in 9M 2018, a 34% increase year-over-year (YoY).
To get the report, visit: https://mercomcapital.com/product/9m-and-q3-2019-solar-funding-and-ma-report/
Corporate funding into the solar sector in Q3 2019 came to $3 billion, compared to $1.3 billion in Q3 2018.
“Corporate funding activity so far this year is ahead of last year’s levels as demand outlook looks positive, and solar public companies continue to do well. In Q3 2019, over $100 million in venture funding went to technology and manufacturing-focused companies which is rare. Five IPOs and over a billion dollars in securitization deals so far this year have been the highlights,” said Raj Prabhu, CEO of Mercom Capital Group.
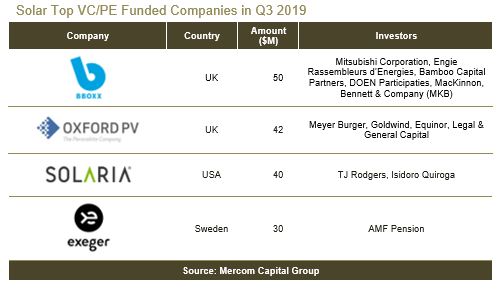
In 9M 2019, global VC funding (venture capital, private equity, and corporate venture capital) in the solar sector was 13% higher with $1 billion compared to $889 million raised in the first nine months of 2018. Global VC/PE funding in Q3 2019 totaled $208 million in 11 deals.
The top VC deals in 9M 2019 were: the $300 million raised by Renew Power, $144 million raised by Avaada Energy, $65 million secured by Yellow Door Energy, $50 million raised by BBOXX, and $50 million raised by Spruce Finance.
A total of 88 VC investors participated in solar funding in 9M 2019.
Solar public market financing in 9M 2019 rose to $2.25 billion in 13 deals, 25% higher compared to $1.8 billion in 14 deals in 9M 2018. Public market financing into the solar sector came to $1.3 billion in five deals in Q3 2019 with the help of two IPOs.
A total of five IPOs in the solar sector have together brought in $1.3 billion in 9M 2019.
Announced debt financing activity in the first nine months of 2019 ($5.8 billion in 37 deals) was 43% higher compared to the first nine months of 2018. Six solar securitization deals brought in a total of $1 billion in 9M 2019. Cumulatively, $4.7 billion has now been raised through securitization deals since 2013.
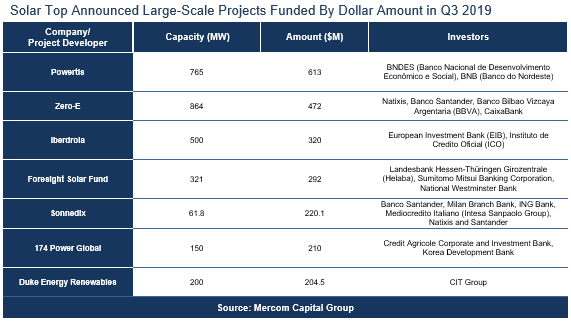
There were a total of 13 project funding deals larger than $100 million in Q3 2019. The top project funding deal in Q3 2019 was Powertis, which received $613 million from BNDES (Banco Nacional de Desenvolvimento Economico e Social) and BNB (Banco do Nordeste), to develop a 765 MW solar PV portfolio in Brazil. A total of 60 investors provided funds for large-scale project development in Q3 2019.
In 9M 2019, there were a total of 57 (10 disclosed) solar M&A transactions compared to 64 (16 disclosed) transactions in 9M 2018.
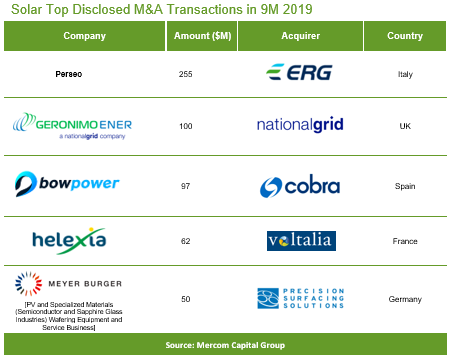
The top M&A solar transaction in 9M 2019 was the $255 million acquisition of a 78.5% stake in Perseo, operator of photovoltaic generation facilities, by ERG, through its subsidiary ERG Power Generation.
There were 20 solar M&A transactions in Q3 2019 compared to 19 solar M&A transactions in Q2 2019 and 18 transactions in Q3 2018. Of the 20 transactions in Q3 2019, 14 involved solar downstream companies, five involved balance of system (BOS) companies, and one deal involved a solar service provider.
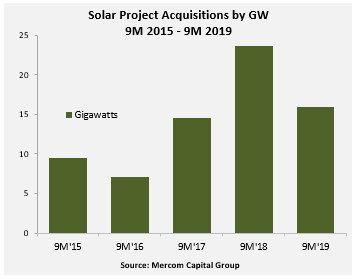
Project acquisition activity was lower in 9M 2019, with 15.9 GW of solar projects acquired, compared to 23.6 GW acquired in the same period last year. In Q3 2019, a total of 34 projects for a combined 4.3 GW were acquired.
Project developers were the major acquirers of solar assets and accounted for about 2.2 GW of acquisitions in Q3 2019, followed by investment firms and funds, which picked up 739 MW of projects, and utilities and independent power producers (IPPs) which acquired 536 MW of projects.
246 companies and investors covered in this 85-page report. The report contains 78 charts, graphs, and tables.
To learn more about the report, visit: https://mercomcapital.com/product/9m-and-q3-2019-solar-funding-and-ma-report/
Image credit: Greenko Group

