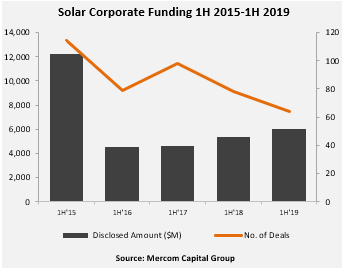
Total corporate funding (including venture capital funding, public market, and debt financing) in the first half (1H) of 2019 was up with $6 billion raised compared to the $5.4 billion raised in 1H 2018, an 11% increase year-over-year (YoY).
Corporate funding increased in Q2 2019 with $3.3 billion in 29 deals compared to the $2.7 billion in 35 deals in Q1 2019. Year-over-year funding in Q2 2019 was about 12% higher compared to the $2.9 billion in Q2 2018.
To get the report, visit: http://bit.ly/MercomSolarQ22019
“Financial activity was up in the first half of the year and there is optimism in the global markets, which was reflected by climbing solar stock prices. Demand in Europe has picked up post MIP. Market activity in the U.S. is up before the ITC step down kicks in and the duty exemption for bifacial modules has provided a much needed boost. Solar activity in India is expected to pick up post elections. However, China remains the wild card,” said Raj Prabhu, CEO of Mercom Capital Group.
In 1H 2019, Global VC funding (venture capital, private equity, and corporate venture capital) in the solar sector was 50% higher with $799 million compared to $531 million raised in the first half of 2018.
In Q2 2019, Global VC funding increased to $622 million in 16 deals compared to $370 million raised in 15 deals in Q2 2018, almost 68% higher YoY.
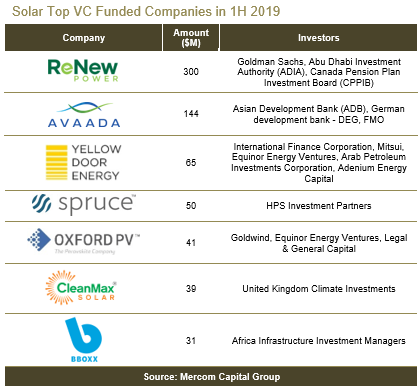
Top VC/PE deals in 1H 2019 included: $300 million raised by Renew Power, $144 million raised by Avaada Energy, $65 million secured by Yellow Door Energy, $50 million raised by Spruce Finance, $41 million raised by Oxford Photovoltaics, $39 million raise by CleanMax Solar, and the $31 million raised by BBOXX.
A total of 62 VC investors participated in solar funding in 1H 2019.
Solar public market financing in 1H 2019 was 20% lower compared to the first half of 2018 with $993 million in eight deals compared to $1.2 billion in 12 deals in 1H 2018. Public market financing in the solar sector rose to $746 million in five deals in Q2 2019 compared to $247 million in three deals in Q1 2019, and $1.14 billion in eight deals during Q2 2018.
Announced debt financing activity in the first half of 2019 ($4.2 billion in 27 deals) was 16% higher compared to the first half of 2018 when $3.6 billion was raised in 32 deals. There were four solar securitization deals totaling $598 million in 1H 2019. Cumulatively, over $4 billion has now been raised through securitization deals since 2013.
Announced large-scale project funding in the first half of 2019 saw $9 billion announced for 76 projects compared to 1H 2018 when $8 billion went into 98 project funding deals.
Announced residential and commercial solar funds totaled $327 million in 1H 2019.
In 1H 2019 there were a total of 37 solar M&A transactions compared to 46 transactions in 1H 2018.
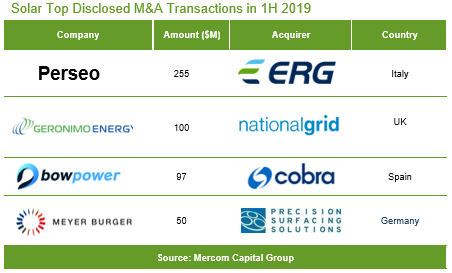
There were six disclosed M&A transactions in 1H 2019. By comparison, there were 14 disclosed M&A transactions in 1H 2018. The top deal in 1H 2019 was ERG, through its subsidiary ERG Power Generation, which acquired a 78.5% stake in Perseo, operator of photovoltaic generation facilities, for $255 million.
There were 19 solar M&A transactions in Q2 2019. By comparison, there were 18 solar M&A transactions in Q1 2019 and 27 transactions in Q2 2018. Of the 19 transactions in Q2 2019, 12 involved solar downstream companies, four involved equipment manufacturers, two solar PV manufacturers, and one deal involved a solar service provider.
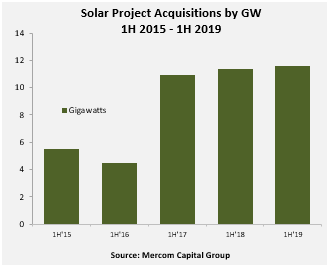
Project acquisition activity was up slightly in 1H 2019 with 11.6 GW of solar projects acquired compared to 11.3 GW acquired in the same period last year. Investment firms continued to be major acquirers of solar assets and accounted for about 6.8 GW (58%) of acquisitions.
There were 262 companies and investors covered in this report. It is 85 pages in length and contains 76 charts, graphs, and tables.
To learn more about the report, visit: http://bit.ly/MercomSolarQ22019