

Q3 2017 Solar Funding and M&A Report
Price range: $299.00 through $499.00
Third-quarter total corporate funding
falls 19% year-over-year to $2.4 billion
– Learn Why!
Click here to download the executive summary for Mercom’s Q3 2017 Solar Funding and M&A Report.
Total corporate funding (including venture capital funding, public market, and debt financing) into the solar sector in Q3 2017 amounted to $2.4 billion in 45 deals, a 74 percent increase compared to the $1.4 billion raised in 37 deals in Q2 2017.
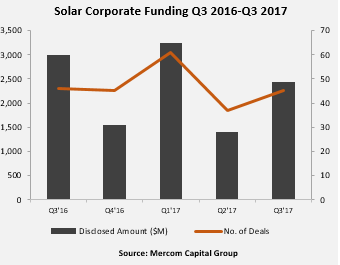
“Debt financing activity outside of the United States helped bump up corporate funding in the third quarter as financing activity in the United States was muted ahead of the Suniva anti-dumping case decision,” commented Raj Prabhu, CEO of Mercom Capital Group.
Global VC funding for 2017 has now reached $985 million, a slight increase compared to the $925 million raised during the same period last year.
In Q3 2017, China recorded the most debt deals while India saw the highest debt amount raised. Other countries with debt deals were Australia, Germany, Italy, and the United States.
Announced large-scale project funding came to more than $2.8 billion in 36 deals in Q3 2017. The 36 announced large-scale project funding deals in Q3 2017 were distributed across 18 countries worldwide. Most of the funding went to solar projects in Egypt.
In the first nine months of 2017 there were a total of 58 M&A transactions, compared to 48 transactions in 9M 2016.
In Q3 2017, investment firms and funds were the most active acquirers followed by project developers. There was no acquisition activity by yieldcos this quarter.
There were 580 companies and investors covered in this report. It is 105 pages in length, and contains 84 charts, graphs and tables.
Mercom Capital Group’s Quarterly Solar Funding and M&A Reports deliver comprehensive, high-quality analysis and superior insight into solar market trends around the globe. This must-read report gives professionals a clear vision on the financial landscape of the global solar industry, and helps them make solid business decisions that put them ahead of the market.
Also available:
Custom Excel Sheets with all transactions for the quarter, and
Custom Research with data from the past 5 years!
Contact us to learn more and get pricing!
Quarterly market and deal activity displayed in easy-to-digest charts, graphs and tables, alongside data-driven analysis.
The report covers all types of deals and financing activity, including:
- Venture capital funding deals, including top investors, QoQ trends, and a breakdown of charts and graphs by technology, sector, stage and country;
- Large-scale project funding deals, including top investors, QoQ trends and breakdown charts and graphs by technology and country;
- Public market financing, including equity financing, private placements and rights issues;
- Debt and other funding deals, as well as QoQ trends;
- Third-party residential/commercial project funds;
- Large-scale project acquisitions and active project acquirers;
- Large-scale project announcements in various levels of development throughout the world;
- Mergers and acquisitions (M&A), including QoQ trends, a breakdown of charts and graphs by technology and sector, as well as project M&A activity;
- New cleantech and solar funds;
- New large-scale project announcements;
- Large-scale project costs per MW.
This report also contains comprehensive lists of all announced Q3:
- VC funding, debt financing, public equity financing, and project funding deals;
- VC and project funding investors;
- M&A transactions;
- Project acquisitions by amounts and megawatts;
- M&A, and project M&A transactions;
- Large-scale project announcements.
Mercom’s comprehensive report covers deals of all sizes across the globe. Have questions about the report? Email us here.
RELATED PRODUCTS
Other reports you may be interested in
Q1 2026 Total Solar Corporate Funding
Totals $11 Billion
Bundle and Save 20%
Get Q1, Q2, Q3, and Q4 + Annual 2026 Wrap Up
9M and Q3 2025 Total Smart Grid Corporate Funding
Totals $2.8 Billion
9M and Q3 2025 Total Energy Storage Corporate Funding
Totals $11.2 Billion
9M 2025 Total Corporate Funding
Totals $17.3 Billion
1H and Q2 2025 Total Corporate Funding
Totals $10.8 Billion
Q1 2025 Total Corporate Funding
Totals $4.1 Billion
Bundle and Save 20%
Get Q1, Q2, Q3, and Q4 + Annual 2025 Wrap Up
Q4 2024 Annual Corporate Funding
Totals $26.3 Billion