

9M and Q3 2023 Solar Funding and M&A Report
Price range: $299.00 through $499.00
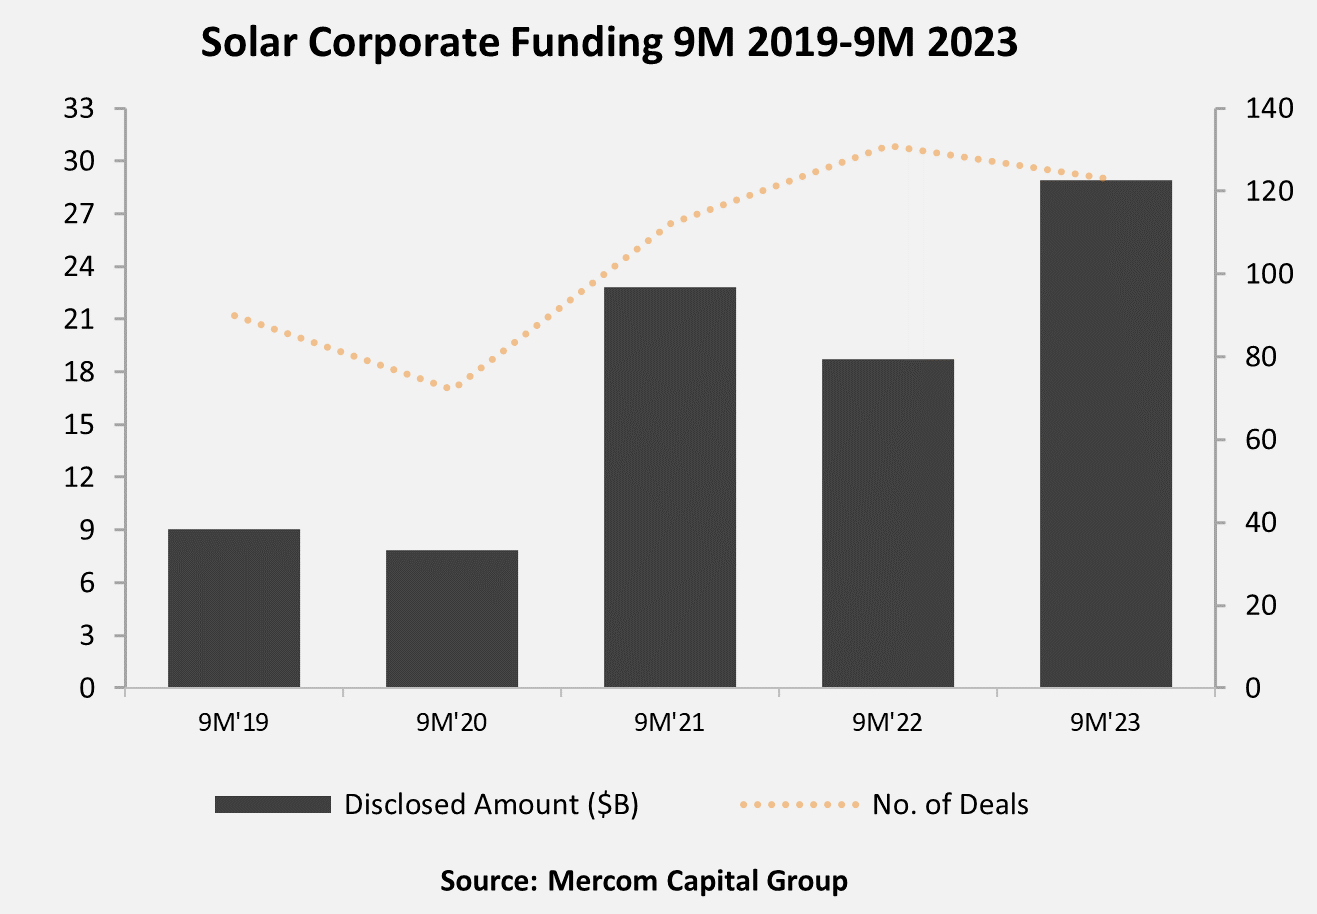
9M 2023 Total Corporate Funding
Totals $28.9 Billion
– See the Details!
Click here to download the Executive Summary.
Total corporate funding, including venture capital (VC) funding, public market, and debt financing, in 9M 2023 stood at $28.9 billion, 55% higher than $18.7 billion raised in 9M 2022. However, the number of deals decreased by 5% year-over-year (YoY), with 124 in 9M 2023 compared to 131 in 9M 2022.
“Despite inflationary challenges and elevated interest rates, financing in the solar industry has remained robust through the first three quarters of 2023. This resilience can be attributed to a strong global push to achieve energy transition objectives and substantial demand created by the Inflation Reduction Act – which has helped the sector weather persistent economic challenges and retain the interest of investors,” remarked Raj Prabhu, CEO of Mercom Capital Group. “M&A activity, on the other hand, has faced adverse effects, especially in the realm of project acquisitions, due to increased due diligence, higher costs, delays, and a tight labor market.”
In 9M 2023, VC funding activity rose 4% YoY, with $5.7 billion in 51 deals compared to the $5.5 billion raised in 72 deals in 9M 2022.
Announced solar debt financing activity in 9M 2023 totaled $16 billion in 54 deals, 93% higher than 9M 2022 when $8.3 billion was raised in 48 deals.
In 9M 2023, 10 securitization deals totaled $3.2 billion, a 39% increase YoY compared to the $2.3 billion raised in eight deals in 9M 2022.
There were 267 companies and investors covered in this report. It is 100 pages in length and contains 74 charts, graphs, and tables.
Mercom Capital Group’s Quarterly Solar Funding and M&A Reports are comprehensive high-quality reports delivering superior insight, market trends, and analysis. These reports help bring clarity to professionals in the current financial landscape of the solar industry.
Also available:
Custom Excel Sheets with all transactions for the quarter, and
Custom Research with data from the past 5 years!
Contact us to learn more and get pricing!
Quarterly market and deal activity displayed in easy-to-digest charts, graphs, and tables, alongside data-driven analysis.
The report covers all types of deals and financing activity, including:
- Venture capital funding deals, including top investors, QoQ and YoY trends, and a breakdown of charts and graphs by technology, sector, stage, and country;
- Large-scale project funding deals, including top investors, QoQ and YoY trends and breakdown charts and graphs by technology and country;
- Public market financing, including equity financing, private placements, and rights issues;
- Debt and other funding deals, as well as QoQ and YoY trends;
- Third-party residential/commercial project funds;
- Large-scale project acquisitions and active project acquirers;
- Large-scale project announcements in various levels of development throughout the world;
- Mergers and acquisitions (M&A), including QoQ and YoY trends, a breakdown of charts and graphs by technology and sector, as well as project M&A activity;
- New cleantech and solar funds;
- New large-scale project announcements;
- Large-scale project costs per MW.
This report also contains comprehensive lists of all announced Q3:
- VC funding, debt financing, public equity financing, and project funding deals;
- VC and project funding investors;
- M&A transactions;
- Project acquisitions by amounts and megawatts;
- M&A, and project M&A transactions;
- Large-scale project announcements.
Mercom’s comprehensive report covers deals of all sizes across the globe. Have questions about the report? Email us here.
RELATED PRODUCTS
Other reports you may be interested in
Q1 2026 Total Solar Corporate Funding
Totals $11 Billion
Bundle and Save 20%
Get Q1, Q2, Q3, and Q4 + Annual 2026 Wrap Up
9M and Q3 2025 Total Smart Grid Corporate Funding
Totals $2.8 Billion
9M and Q3 2025 Total Energy Storage Corporate Funding
Totals $11.2 Billion
9M 2025 Total Corporate Funding
Totals $17.3 Billion
1H and Q2 2025 Total Corporate Funding
Totals $10.8 Billion
Q1 2025 Total Corporate Funding
Totals $4.1 Billion
Bundle and Save 20%
Get Q1, Q2, Q3, and Q4 + Annual 2025 Wrap Up
Q4 2024 Annual Corporate Funding
Totals $26.3 Billion