

1H and Q2 2019 Digital Health (Healthcare IT) Funding and M&A Report
Price range: $299.00 through $549.00
Healthcare IT VC Funding Hits
$5.1 Billion in 1H 2019
– Get the Details!
Click here to download the Executive Summary.
The report covers both consumer-centric and patient-centric technologies and sub-technologies, including: Social Health, Mobile Health (mHealth), Telehealth, Personal Health, Rating & Shopping, Health Information Management, Revenue Cycle Management, Service Providers and Security. Click here to see our complete list of technologies.
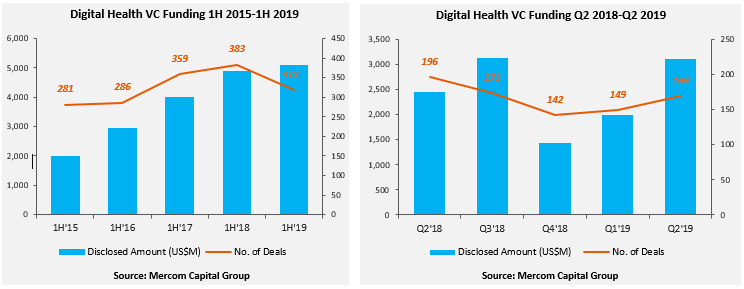
Global VC funding for Digital Health companies in 1H 2019 was slightly higher year-over-year (YoY) with $5.1 billion raised in 318 deals compared to the $4.9 billion in 383 deals in 1H 2018. Q2 2019 VC funding held strong at $3.1 billion in 169 deals following the $2 billion raised in 149 deals in Q1 2019. This is the highest amount raised in the first six months of a year so far.
Digital Health companies have now received over $40 billion in VC funding deals since 2010. U.S. Digital Health companies have raised approximately $30 billion to date.
Total corporate funding in Digital Health companies – including VC, debt, and public market financing – set a new record for the second quarter with $3.3 billion in Q2 2019 compared to $2.2 billion in Q1 2019. In 1H 2019, there was one IPO for $179.4 million.
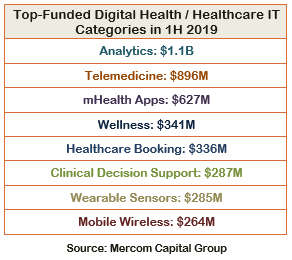
The top funded categories in 1H 2019 were: Analytics with $1.1 billion, Telemedicine with $896 million, mHealth Apps with $627 million, Wellness with $341 million, Healthcare Booking with $336 million, Clinical Decision Support with $287, Wearable Sensors with $285 million, Mobile Wireless with $264 million, and Healthcare Benefits with $208 million.
The top funded categories in Q2 2019 were: Telemedicine companies with $676 million, Analytics with $551 million, Wellness with $304 million, mHealth Apps with $236 million, Wearable Sensors with $226 million, Healthcare Benefits with $208 million, Clinical Decision Support with $180 million, Mobile Wireless with $174 million, and Healthcare Booking with $159 million.
There were 73 early stage deals in Q2 2019, compared to 48 deals in Q1 2019.
A total of 821 investors participated in Digital Health funding deals in the first half of 2019. There were 450 investors that participated in funding deals in Q2 2019, compared to 371 investors in Q1 2019.
In 1H 2019, there were a total of 91 Digital Health M&A transactions, compared to 116 in 1H 2018. In Q2 2019, there were 46 M&A transactions, compared to 68 M&A transactions in Q2 2018.
Notable M&A transactions in 1H 2019 were: Dassault Systemes acquired Medidata for $5.8 billion, Golden Gate Capital acquired a 51% stake in Ensemble Health Partners for $1.2 billion, Nordic Capital acquired a majority stake in ArisGlobal for $700 million, JPMorgan Chase acquired InstaMed for more than $500 million, Thomas H. Lee Partners (THL) acquired Nextech Systems for $500 million, and Hill-Rom Holdings acquired Voalte for $195 million.
A total of 624 companies and investors were covered in this report.
The 1H and Q2 2019 Digital Health (Healthcare IT) Funding and M&A Report contains annual, quarter-over-quarter (QoQ) information on market activity displayed in easy-to-digest charts, graphs and tables, as well as data-driven analysis covering:
- Venture capital (VC) funding deals, including top investors, QoQ trends, and charts and graphs broken down by technology and stage;
- Practice-focused technology and subgroups;
- Consumer-focused technology and subgroups;
- VC funding by country and U.S. state;
- VC funding trends in early stage deals (below $2 million) and trends in deals over $2 million;
- Debt and public market financing deals;
- Mergers and acquisitions (M&A), including QoQ trends, a breakdown of charts and graphs by technology and geography;
- New Healthcare IT funds
- Half-year trends and analysis
This report also contains comprehensive lists of all announced Q2:
- VC deals with investors and transaction details;
- Debt and public market financing deals and investors;
- M&A transactions and acquirers.
This report is 99 pages in length, contains 65 charts, graphs and tables, and covers 624 investors and companies.
RELATED PRODUCTS
Other reports you may be interested in
Venture Capital Funding
in Digital Health Sector
Reaches $15 Billion in 1H 2021
Venture Capital Funding
in Digital Health Sector
Reaches $7.2 Billion in Q1 2021
Bundle and Save ~20%
Get Quarterly Reports + The Annual Wrap
- Claim Your Deal!
Venture Capital Funding
in Digital Health Sector
Reaches $14.8 Billion in 2020
Digital Health VC Funding Hits
$10.3 Billion in 9M 2020
- Get the Details!
Digital Health/Healthcare IT VC Funding Hits
$6.3 Billion in 1H 2020
- Get the Details!
Bundle and Save ~20%
Get Quarterly Reports + The Annual Wrap
- Claim Your Deal!
Venture Capital Funding
in Digital Health Sector
Reaches $3.6 Billion in Q1 2020
Venture Capital Funding
in Digital Health Sector
Reaches $8.9 Billion in 2019
Digital Health VC Funding Hits
$7.2 Billion in 9M 2019
- Get the Details!