

1H and Q2 2018 Digital Health (Healthcare IT) Funding and M&A Report
Price range: $299.00 through $549.00
Healthcare IT Funding Jumps
To $4.9 Billion During 1H 2018
– Get the Details!
Click here to download the Executive Summary.
The report covers both consumer-centric and patient-centric technologies and sub-technologies, including: Social Health, Mobile Health (mHealth), Telehealth, Personal Health, Rating & Shopping, Health Information Management, Revenue Cycle Management, Service Providers and Security. Click here to see our complete list of technologies.
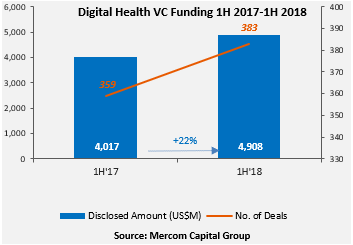
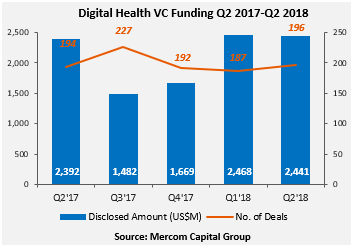
Global VC funding for Digital Health companies in 1H 2018 was 22 percent higher year-over-year (YoY) with a record $4.9 billion raised in 383 deals compared to the $4 billion in 359 deals in 1H 2017. Q2 2018 VC funding held strong at $2.4 billion in 196 deals following the $2.5 billion raised in 187 deals in Q1 2018.
Digital Health companies have now received $30.6 billion in the 3,833 VC funding deals Mercom has tracked since 2010.
Total corporate funding in Digital Health companies – including VC, debt, and public market financing – also set a new record at $4.4 billion in Q2 2018 compared to $3 billion in Q1 2018.
“Digital Health continues to grow at a record pace and is well on its way to smashing 2017’s record of $7.2 billion in VC funding.” commented Raj Prabhu, CEO and Co-Founder of Mercom Capital Group. “The space is maturing and is beginning to get the regulatory attention it deserves. Simultaneously, the tech giants are boosting digital health in a big way. M&A activity was also up, and overall, it was a very robust first half of 2018 for digital health companies.”
Healthcare practice-centric companies received 29 percent of the funding in Q2 2018, raising $702 million in 58 deals compared to $1.7 billion in 74 deals in Q1 2018. Consumer-centric companies accounted for 71 percent of the funding in Q2 2018, raising $1.7 billion in 138 deals compared to $801 million in 113 deals in Q1 2018.
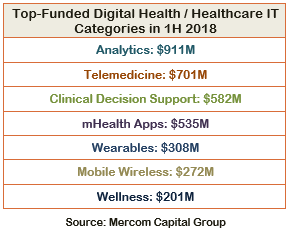
The top funded areas in 1H 2018 were: Data Analytics with $911 million, Telemedicine with $701 million, Clinical Decision Support with $582 million, mHealth Apps with $535 million, Wearables for $308 million, Mobile Wireless with $272 million, and Wellness with $201 million.
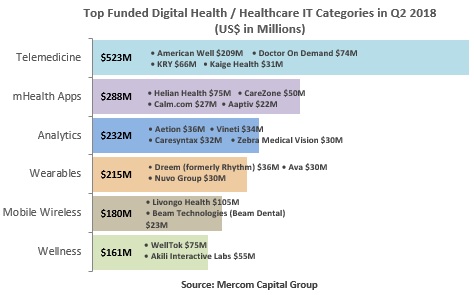
The top funded categories in Q2 2018 were: Telemedicine companies with $523 million, mHealth Apps with $288 million, Data Analytics for $232 million, Wearables with $215 million, Mobile Wireless for $180 million, and Wellness with $161 million.
There were 49 early stage deals in Q2 2018, including six accelerator and incubator deals.
In 1H 2018, there were a total of 116 Digital Health M&A transactions, compared to 90 in 1H 2017. M&A activity in the second quarter of 2018 was also up with 68 M&A transactions (13 disclosed) compared to the 48 M&A transactions (13 disclosed) in Q1 2018.
mHealth App companies were involved in the most M&A deals in Q2 2018 with 11 transactions followed by Data Analytics with 10 deals. Practice Management Solutions, Telemedicine, and Wellness companies secured five deals each.
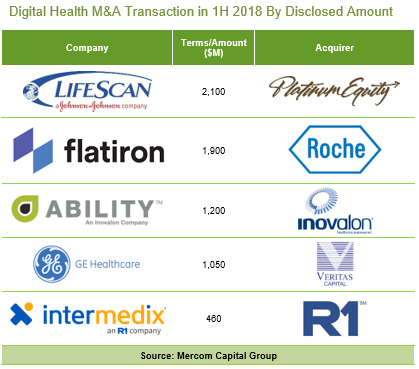
Prominent M&A transactions in 1H 2018 included: the acquisition of LifeScan for $2.1 billion by Platinum Equity, Flatiron Health acquired by Roche for $1.9 billion, Inovalon’s acquisition of ABILITY Network for $1.2 billion, Veritas Capital acquired General Electric’s (GE) Healthcare IT division for $1 billion, and the acquisition of Intermedix by R1 RCM for $460 million.
The 1H and Q2 2018 Digital Health (Healthcare IT) Funding and M&A Report also contains half-year and quarter-over-quarter (QoQ) information on market activity displayed in easy-to-digest charts, graphs and tables, as well as data-driven analysis covering:
- Venture capital (VC) funding deals, including top investors, QoQ trends, and charts and graphs broken down by technology and stage;
- Practice-focused technology and subgroups;
- Consumer-focused technology and subgroups;
- VC funding by country and U.S. state;
- VC funding trends in early stage deals (below $2 million) and trends in deals over $2 million;
- Debt and public market financing deals;
- Mergers and acquisitions (M&A), including QoQ trends, a breakdown of charts and graphs by technology and geography;
- New Healthcare IT funds
This report also contains comprehensive lists of all announced Q2 2018:
- VC deals with investors and transaction details;
- Debt and public market financing deals and investors;
- M&A transactions and acquirers.
This report is 115 pages in length, contains 67 charts, graphs and tables, and covers 732 investors and companies.
RELATED PRODUCTS
Other reports you may be interested in
Venture Capital Funding
in Digital Health Sector
Reaches $15 Billion in 1H 2021
Venture Capital Funding
in Digital Health Sector
Reaches $7.2 Billion in Q1 2021
Bundle and Save ~20%
Get Quarterly Reports + The Annual Wrap
- Claim Your Deal!
Venture Capital Funding
in Digital Health Sector
Reaches $14.8 Billion in 2020
Digital Health VC Funding Hits
$10.3 Billion in 9M 2020
- Get the Details!
Digital Health/Healthcare IT VC Funding Hits
$6.3 Billion in 1H 2020
- Get the Details!