

Q1 2021 Solar Funding and M&A Report
Price range: $299.00 through $499.00
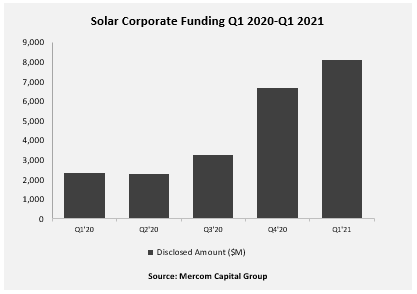
Q1 2021 Total Corporate Funding
Totals $8.1 Billion
– See the Details!
Click here to download the Executive Summary.
Total corporate funding, including venture capital funding, public market, and debt financing into the solar sector in Q1 2021, came to $8.1 billion in 36 deals, a 21% increase compared to $6.7 billion raised in 43 deals in Q4 2020.
“Financing activity in the solar sector started strong in 2021 with Q1 numbers up substantially year-over-year. Even though solar stocks lost some of their spark in the first quarter after an unprecedented run in 2020, a big IPO and record securitization activity lifted overall fundraising totals. Solar assets continue to be in great demand with almost 15 GW of projects acquired in Q1,” said Raj Prabhu, CEO of Mercom Capital Group.
Global VC funding for the solar sector in Q1 2021 came to $1 billion in 14 deals, a 33% increase compared to $773 million raised in 12 deals in Q4 2020.
Announced debt financing in Q1 2021 jumped to $4.3 billion in 14 deals, a 48% increase compared to Q4 2020, when $2.9 billion was raised in 14 deals.
There were 20 solar M&A transactions in Q1 2021 compared to 12 deals in Q1 2020. Of the 20 solar M&A transactions announced in Q1 2021, 15 involved Solar Downstream companies, followed by three Balance of System (BOS) companies.
There were 82 large-scale solar project acquisitions (nine disclosed for $854 million) in Q1 2021, compared to 83 transactions (15 disclosed for $2 billion) in Q4 2020. Acquired projects totaled 14.6 GW in Q1 2021 compared to 15.2 GW in Q4 2020.
There were 340 companies and investors covered in this 91 page report, which contains 73 charts, graphs, and tables.
Mercom Capital Group’s Quarterly Solar Funding and M&A Reports are comprehensive high-quality reports delivering superior insight, market trends and analysis. These reports help bring clarity to professionals in the current financial landscape of the solar industry.
Also available:
Custom Excel Sheets with all transactions for the quarter, and
Custom Research with data from the past 5 years!
Contact us to learn more and get pricing!
Quarterly market and deal activity displayed in easy-to-digest charts, graphs and tables, alongside data-driven analysis.
The report covers all types of deals and financing activity, including:
- Venture capital funding deals, including top investors, QoQ and YoY trends, and a breakdown of charts and graphs by technology, sector, stage and country;
- Large-scale project funding deals, including top investors, QoQ and YoY trends and breakdown charts and graphs by technology and country;
- Public market financing, including equity financing, private placements and rights issues;
- Debt and other funding deals, as well as QoQ and YoY trends;
- Third-party residential/commercial project funds;
- Large-scale project acquisitions and active project acquirers;
- Large-scale project announcements in various levels of development throughout the world;
- Mergers and acquisitions (M&A), including QoQ and YoY trends, a breakdown of charts and graphs by technology and sector, as well as project M&A activity;
- New cleantech and solar funds;
- New large-scale project announcements;
- Large-scale project costs per MW.
This report also contains comprehensive lists of all announced Q1:
- VC funding, debt financing, public equity financing, and project funding deals;
- VC and project funding investors;
- M&A transactions;
- Project acquisitions by amounts and megawatts;
- M&A, and project M&A transactions;
- Large-scale project announcements.
Mercom’s comprehensive report covers deals of all sizes across the globe. Have questions about the report? Email us here.
RELATED PRODUCTS
Other reports you may be interested in
Q1 2026 Total Solar Corporate Funding
Totals $11 Billion
Bundle and Save 20%
Get Q1, Q2, Q3, and Q4 + Annual 2026 Wrap Up
9M and Q3 2025 Total Smart Grid Corporate Funding
Totals $2.8 Billion
9M and Q3 2025 Total Energy Storage Corporate Funding
Totals $11.2 Billion
9M 2025 Total Corporate Funding
Totals $17.3 Billion
1H and Q2 2025 Total Corporate Funding
Totals $10.8 Billion
Q1 2025 Total Corporate Funding
Totals $4.1 Billion
Bundle and Save 20%
Get Q1, Q2, Q3, and Q4 + Annual 2025 Wrap Up
Q4 2024 Annual Corporate Funding
Totals $26.3 Billion