

Q1 2019 Digital Health (Healthcare IT) Funding and M&A Report
Price range: $299.00 through $549.00
Healthcare IT VC Funding Hits
$2 Billion in Q1 2019
– Get the Details!
Click here to download the Executive Summary.
The report covers both consumer-centric and patient-centric technologies and sub-technologies, including: Social Health, Mobile Health (mHealth), Telehealth, Personal Health, Rating & Shopping, Health Information Management, Revenue Cycle Management, Service Providers and Security. Click here to see our complete list of technologies.
Total corporate funding for Digital Health companies – including VC, debt, and public market financing – totaled $2.2 billion in Q1 2019.
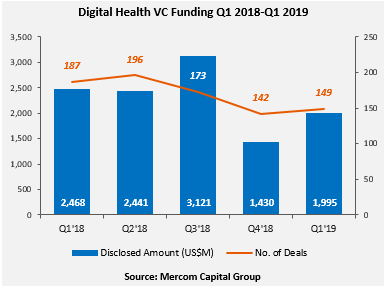
Venture capital (VC) funding, including private equity and corporate venture capital into Digital Health (Healthcare IT) companies in Q1 2019, came to $2 billion in 149 deals compared to $1.4 billion in 142 deals in Q4 2018. VC funding in Q1 2019 was down 19% compared to the same quarter of last year (Q1 2018) when nearly $2.5 billion was raised in 187 deals.
Digital Health companies have brought in over $37 billion in disclosed VC funding since 2010.
“Funding levels were down compared to last year in Digital Health in the absence of larger deals. M&A activity was also flat. However, Digital Health public equities experienced a turnaround in Q1 with 66% of them beating the S&P 500 compared to Q4 2018 when 63% of the equities we tracked performed below the S&P 500. Favorable market conditions have prompted several companies to announce IPO plans,” said Raj Prabhu, CEO of Mercom Capital Group.
The top funded categories in Q1 2019 were: $557 million raised by Data Analytics companies, mHealth Apps with $392 million, Telemedicine with $220 million, Healthcare Booking with $177 million, Clinical Decision Support with $107 million, Mobile Wireless with $90 million and $80 million for Healthcare IT Service Providers.

The top VC deals in Q1 2019 included: $170 million raised by Doctolib, $100 million from Health Catalyst, $88 million raised by Calm, and $80 million by Taimei Medical Technology.
There were 48 early-round deals in Q1 2019.
A total of 371 investors participated in funding deals in Q1 2019 compared to 412 investors in Q1 2018. There were 16 FDA and CE approvals issued to Digital Health companies in Q1 2019.
In Q1 2019, there were 45 M&A transactions (seven disclosed) involving Digital Health companies compared to 48 M&A transactions (13 disclosed) in Q1 2018.
The top disclosed M&A transactions included the $195 million acquisition of Voalte by Hill-Rom Holdings, followed by BioTelemetry’s acquisition of Geneva Healthcare for $65 million. Alphabet’s Google acquired Fossil Group’s intellectual property related to a smartwatch technology currently under development for $40 million, Netmeds acquisition of KiViHealth for $10 million and Livongo Health’s acquisition of myStrength for $10 million.
A total of 610 companies and investors were covered in this report.
The Q1 Digital Health (Healthcare IT) Funding and M&A Report contains annual, quarter-over-quarter (QoQ) information on market activity displayed in easy-to-digest charts, graphs and tables, as well as data-driven analysis covering:
- Venture capital (VC) funding deals, including top investors, QoQ trends, and charts and graphs broken down by technology and stage;
- Practice-focused technology and subgroups;
- Consumer-focused technology and subgroups;
- VC funding by country and U.S. state;
- VC funding trends in early stage deals (below $2 million) and trends in deals over $2 million;
- Debt and public market financing deals;
- Mergers and acquisitions (M&A), including QoQ trends, a breakdown of charts and graphs by technology and geography;
- New Healthcare IT funds
This report also contains comprehensive lists of all announced Q1:
- VC deals with investors and transaction details;
- Debt and public market financing deals and investors;
- M&A transactions and acquirers.
This report is 93 pages in length, contains 60 charts, graphs and tables, and covers 610 investors and companies.
RELATED PRODUCTS
Other reports you may be interested in
Venture Capital Funding
in Digital Health Sector
Reaches $15 Billion in 1H 2021
Venture Capital Funding
in Digital Health Sector
Reaches $7.2 Billion in Q1 2021
Bundle and Save ~20%
Get Quarterly Reports + The Annual Wrap
- Claim Your Deal!
Venture Capital Funding
in Digital Health Sector
Reaches $14.8 Billion in 2020
Digital Health VC Funding Hits
$10.3 Billion in 9M 2020
- Get the Details!
Digital Health/Healthcare IT VC Funding Hits
$6.3 Billion in 1H 2020
- Get the Details!
Bundle and Save ~20%
Get Quarterly Reports + The Annual Wrap
- Claim Your Deal!
Venture Capital Funding
in Digital Health Sector
Reaches $3.6 Billion in Q1 2020
Venture Capital Funding
in Digital Health Sector
Reaches $8.9 Billion in 2019
Digital Health VC Funding Hits
$7.2 Billion in 9M 2019
- Get the Details!