

Q1 2018 Healthcare IT / Digital Health Funding and M&A Report
$299.00 – $549.00
Healthcare IT Funding Jumps
To $2.5 Billion During Q1 2018
– Get the Details!
Click here to download the Executive Summary.
The report covers both consumer-centric and patient-centric technologies and sub-technologies, including: Social Health, Mobile Health (mHealth), Telehealth, Personal Health, Rating & Shopping, Health Information Management, Revenue Cycle Management, Service Providers and Security. Click here to see our complete list of technologies.
Total corporate funding for Digital Health companies – including VC, debt, and public market financing – came close to $3 billion in Q1 2018 compared to $1.8 billion in Q4 2017.
Venture capital (VC) funding, including private equity and corporate venture capital, into Digital Health (Healthcare IT) companies in Q1 2018 surged to a record $2.5 billion raised in 187 deals. Q1 2018 was only the second quarter since 2010 in which Digital Health companies surpassed $2 billion in VC funding.
The Digital Health sector has now accumulated $28 billion in disclosed VC funding since 2010.
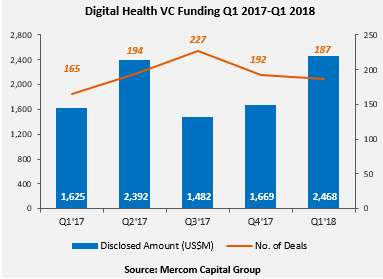
“Digital Health VC is off to a record start in 2018 with $2.5 billion beating the previous record of $2.4 billion from Q2 2017. Several large deals over $100 million pushed the funding total up in the quarter, with activity powered by over 400 investors,” commented Raj Prabhu, CEO and Co-Founder of Mercom Capital Group.
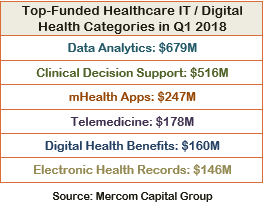
The top funded categories in Q1 2018 were: $679 million raised by Data Analytics companies, Clinical Decision Support with $516 million, mHealth Apps with $247 million, Telemedicine’s $178 million, Benefits with $160 million, and $146 million from Electronic Health Records.
The top VC deals in Q1 2018 included: $240 million raised by Heartflow, $200 million from Helix, $200 million raised by SomaLogic, $146 million by PointClickCare, and Collective Health’s $110 million raise.
There were 55 early-round deals in Q1 2018, including three accelerator and incubator deals.
A total of 412 investors (including one accelerator/incubator) participated in funding deals in Q1 2018 compared to 371 investors in Q4 2017, of which 13 were accelerators/incubators.
There were 48 M&A transactions (13 disclosed) in the Digital Health sector in Q1 2018. There was one IPO launched in Q1 from Chinese fitness tracker and smartwatch maker, Huami, which raised $110 million and listed on the New York Stock Exchange.
The top disclosed M&A transactions were: the $1.9 billion acquisition of Flatiron Health by Roche, ABILITY Network’s $1.2 billion acquisition by Inovalon, Intermedix’ $460 million acquisition by R1 RCM, Clearlake Capital Group’s acquisition of ProVation Medical for $180 million, and the $100 million acquisition of Practice Fusion by Allscripts.
A total of 698 companies and investors were covered in this report.
The Q1 Digital Health (Healthcare IT) Funding and M&A Report contains annual, quarter-over-quarter (QoQ) information on market activity displayed in easy-to-digest charts, graphs and tables, as well as data-driven analysis covering:
- Venture capital (VC) funding deals, including top investors, QoQ trends, and charts and graphs broken down by technology and stage;
- Practice-focused technology and subgroups;
- Consumer-focused technology and subgroups;
- VC funding by country and U.S. state;
- VC funding trends in early stage deals (below $2 million) and trends in deals over $2 million;
- Debt and public market financing deals;
- Mergers and acquisitions (M&A), including QoQ trends, a breakdown of charts and graphs by technology and geography;
- New Healthcare IT funds
This report also contains comprehensive lists of all announced Q1:
- VC deals with investors and transaction details;
- Debt and public market financing deals and investors;
- M&A transactions and acquirers.
This report is 98 pages in length, contains 61 charts, graphs and tables, and covers 698 investors and companies.
RELATED PRODUCTS
Other reports you may be interested in
Venture Capital Funding
in Digital Health Sector
Reaches $15 Billion in 1H 2021
Venture Capital Funding
in Digital Health Sector
Reaches $7.2 Billion in Q1 2021
Bundle and Save ~20%
Get Quarterly Reports + The Annual Wrap
- Claim Your Deal!
Venture Capital Funding
in Digital Health Sector
Reaches $14.8 Billion in 2020
Digital Health VC Funding Hits
$10.3 Billion in 9M 2020
- Get the Details!
Digital Health/Healthcare IT VC Funding Hits
$6.3 Billion in 1H 2020
- Get the Details!