

9M and Q3 2022 Solar Funding and M&A Report
Price range: $299.00 through $499.00
9M and Q3 2022 Total Corporate Funding
Totals $18.7 Billion
– See the Details!
Click here to download the Executive Summary.
Total corporate funding (including venture capital funding, public market, and debt financing) in 9M 2022 stood at $18.7 billion, 18% lower compared to $22.8 billion raised in 9M 2021. The number of deals increased 17% year-over-year, with 131 in 9M 2022 compared to 112 in 9M 2021.
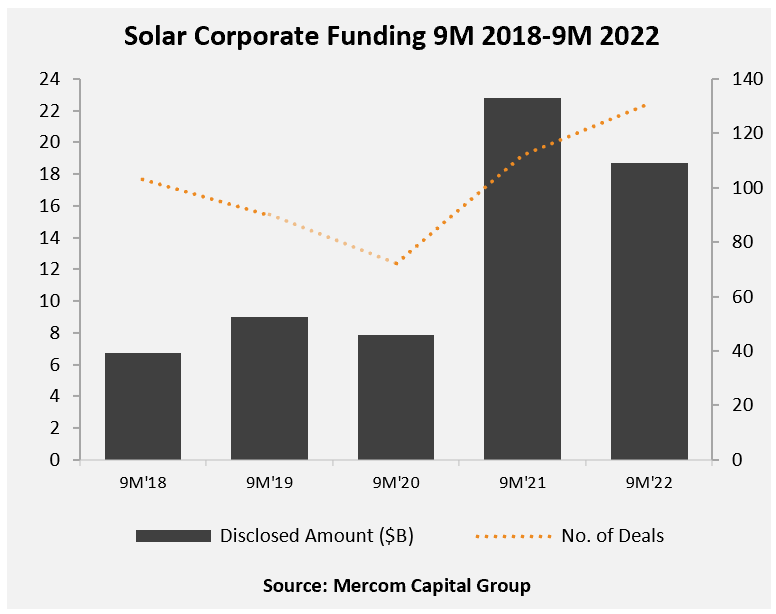
“Corporate funding in 9M 2022 is behind pace year-over-year, impacted by inflation and high-interest rates but is still ahead compared to the previous six years. There is renewed momentum after the passing of the Inflation Reduction Act. We have seen a resurgence in VC and private equity funding, breaking funding records since 2010. There is no longer any doubt about the growth potential of the solar industry – it is now a race to acquire the right technology and portfolios to scale,” said Raj Prabhu, CEO of Mercom Capital Group.
In 9M 2022, venture capital (VC) funding activity rose 150%, with $5.5 billion in 72 deals compared to the $2.2 billion raised in 39 deals in 9M 2021.
Announced solar debt financing activity in 9M 2022 totaled $8.3 billion in 48 deals, 42% lower than 9M 2021 when $14.2 billion was raised in 50 deals.
In 9M 2022, eight securitization deals totaled $2.3 billion, a 28% decrease compared to $3.2 billion in 11 deals in 9M 2021. Cumulatively, over $13.4 billion has been raised through securitization deals since 2013.
In 9M 2022, there were a total of 207 project acquisitions for 52 GW compared to 200 projects acquired for 55.5 GW in 9M 2021.
There were 227 companies and investors covered in this report. It is 100 pages in length and contains 84 charts, graphs, and tables.
Mercom Capital Group’s Quarterly Solar Funding and M&A Reports are comprehensive high-quality reports delivering superior insight, market trends, and analysis. These reports help bring clarity to professionals in the current financial landscape of the solar industry.
Also available:
Custom Excel Sheets with all transactions for the quarter, and
Custom Research with data from the past 5 years!
Contact us to learn more and get pricing!
Quarterly market and deal activity displayed in easy-to-digest charts, graphs, and tables, alongside data-driven analysis.
The report covers all types of deals and financing activity, including:
- Venture capital funding deals, including top investors, QoQ and YoY trends, and a breakdown of charts and graphs by technology, sector, stage, and country;
- Large-scale project funding deals, including top investors, QoQ and YoY trends and breakdown charts and graphs by technology and country;
- Public market financing, including equity financing, private placements, and rights issues;
- Debt and other funding deals, as well as QoQ and YoY trends;
- Third-party residential/commercial project funds;
- Large-scale project acquisitions and active project acquirers;
- Large-scale project announcements in various levels of development throughout the world;
- Mergers and acquisitions (M&A), including QoQ and YoY trends, a breakdown of charts and graphs by technology and sector, as well as project M&A activity;
- New cleantech and solar funds;
- New large-scale project announcements;
- Large-scale project costs per MW.
This report also contains comprehensive lists of all announced Q3:
- VC funding, debt financing, public equity financing, and project funding deals;
- VC and project funding investors;
- M&A transactions;
- Project acquisitions by amounts and megawatts;
- M&A, and project M&A transactions;
- Large-scale project announcements.
Mercom’s comprehensive report covers deals of all sizes across the globe. Have questions about the report? Email us here.
RELATED PRODUCTS
Other reports you may be interested in
Q1 2026 Total Solar Corporate Funding
Totals $11 Billion
Bundle and Save 20%
Get Q1, Q2, Q3, and Q4 + Annual 2026 Wrap Up
9M and Q3 2025 Total Smart Grid Corporate Funding
Totals $2.8 Billion
9M and Q3 2025 Total Energy Storage Corporate Funding
Totals $11.2 Billion
9M 2025 Total Corporate Funding
Totals $17.3 Billion
1H and Q2 2025 Total Corporate Funding
Totals $10.8 Billion
Q1 2025 Total Corporate Funding
Totals $4.1 Billion
Bundle and Save 20%
Get Q1, Q2, Q3, and Q4 + Annual 2025 Wrap Up
Q4 2024 Annual Corporate Funding
Totals $26.3 Billion