

9M and Q3 2018 Digital Health (Healthcare IT) Funding and M&A Report
Price range: $299.00 through $549.00
Healthcare IT Funding Jumps
To $8 Billion During 9M 2018
– Get the Details!
Click here to download the Executive Summary.
The report covers both consumer-centric and patient-centric technologies and sub-technologies, including: Social Health, Mobile Health (mHealth), Telehealth, Personal Health, Rating & Shopping, Health Information Management, Revenue Cycle Management, Service Providers and Security. Click here to see our complete list of technologies.
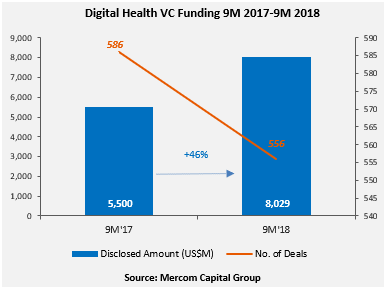
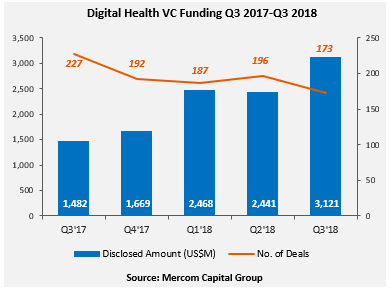
Global VC funding for Digital Health companies in 9M 2018 was 46 percent higher year-over-year (YoY) with a record $8 billion raised in 556 deals compared to the $5.5 billion in 586 deals in 9M 2017. Another annual record will be set in 2018 as the $8 billion has already surpassed the previous high mark of $7.2 billion raised in all of 2017. A new record was also set in Q3 2018 with VC funding coming to $3.1 billion in 173 deals surpassing the $2.4 billion raised in 196 deals in Q2 2018.
Digital Health companies have now received ~$34 billion in the 4,006 VC funding deals, according to Mercom.
Total corporate funding in Digital Health companies – including VC, debt, and public market financing – came to $3.5 billion in Q3 2018 compared to $4.4 billion in Q2 2018.
“For the first time, we saw funding cross $3 billion in a single quarter in digital health and funding raised year-to-date has already surpassed all of 2017 with a realistic chance of hitting $10 billion this year. The sector has significant momentum and substance behind this record funding, from regulatory support to entry of large tech and healthcare companies – including a slew of intellectual property applications and FDA approvals,” said Raj Prabhu, CEO of Mercom Capital Group.
Healthcare Practice-focused companies received 40 percent of the funding in Q3 2018, raising $1.3 billion in 62 deals compared to $702 million in 58 deals in Q2 2018. Healthcare Consumer-centric companies accounted for 60 percent of the funding in Q3 2018, raising $1.9 billion in 111 deals compared to $1.7 billion in 138 deals in Q2 2018.
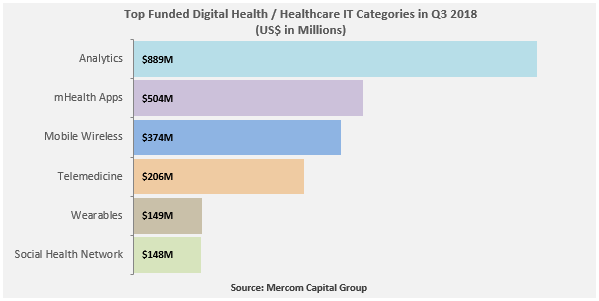
The top funded areas in 9M 2018 were: Data Analytics with $1.8 billion, Telemedicine with $1.1 billion, mHealth Apps with $1 billion, Mobile Wireless with $728 million, Clinical Decision Support with $655 million, Wearables for $457 million, and Wellness with $318 million.
There were 68 early stage deals in Q3 2018, including one accelerator/incubator deal.
The pace of M&A activity year-to-date is slightly ahead of last year. In 9M 2018, there were a total of 172 Digital Health M&A transactions, compared to 146 in 9M 2017. M&A activity in Q3 2018 was down with 56 M&A transactions (nine disclosed) compared to the 68 M&A transactions (13 disclosed) in Q2 2018.
mHealth App companies were involved in the most M&A deals in Q3 2018 with eight transactions followed by Data Analytics and Practice Management Solutions with six deals each, then Digital Health Service Providers with three deals.
Top M&A transactions in 9M 2018 included: Platinum Equity’s acquisition of LifeScan for $2.1 billion, Roche’s acquisition of Flatiron Health for $1.9 billion, Inovalon’s acquisition of ABILITY Network for $1.2 billion, Veritas Capital’s acquisition of General Electric’s (GE) Healthcare IT division for $1 billion, and Bestbuy’s acquisition of Greatcall for $800 million.
The 9M and Q3 2018 Digital Health (Healthcare IT) Funding and M&A Report also contains year-over-year (YoY) and quarter-over-quarter (QoQ) information on market activity displayed in easy-to-digest charts, graphs and tables, as well as data-driven analysis covering:
- Venture capital (VC) funding deals, including top investors, QoQ trends, and charts and graphs broken down by technology and stage;
- Practice-focused technology and subgroups;
- Consumer-focused technology and subgroups;
- VC funding by country and U.S. state;
- VC funding trends in early stage deals (below $2 million) and trends in deals over $2 million;
- Debt and public market financing deals;
- Mergers and acquisitions (M&A), including QoQ trends, a breakdown of charts and graphs by technology and geography;
- New Healthcare IT funds
This report also contains comprehensive lists of all announced Q3 2018:
- VC deals with investors and transaction details;
- Debt and public market financing deals and investors;
- M&A transactions and acquirers.
This report is 107 pages in length, contains 67 charts, graphs and tables, and covers 701 investors and companies.
RELATED PRODUCTS
Other reports you may be interested in
Venture Capital Funding
in Digital Health Sector
Reaches $15 Billion in 1H 2021
Venture Capital Funding
in Digital Health Sector
Reaches $7.2 Billion in Q1 2021
Bundle and Save ~20%
Get Quarterly Reports + The Annual Wrap
- Claim Your Deal!
Venture Capital Funding
in Digital Health Sector
Reaches $14.8 Billion in 2020
Digital Health VC Funding Hits
$10.3 Billion in 9M 2020
- Get the Details!
Digital Health/Healthcare IT VC Funding Hits
$6.3 Billion in 1H 2020
- Get the Details!
Bundle and Save ~20%
Get Quarterly Reports + The Annual Wrap
- Claim Your Deal!
Venture Capital Funding
in Digital Health Sector
Reaches $3.6 Billion in Q1 2020
Venture Capital Funding
in Digital Health Sector
Reaches $8.9 Billion in 2019
Digital Health VC Funding Hits
$7.2 Billion in 9M 2019
- Get the Details!