

Q4 and Annual 2018 Digital Health (Healthcare IT) Funding and M&A Report
Price range: $599.00 through $999.00
2018 Was a Record-Breaking Year for
Healthcare IT & Digital Health Companies
– Find Out Why
Click here to download the Executive Summary.
The report covers both consumer-centric and patient-centric technologies and sub-technologies, including: Social Health, Mobile Health (mHealth), Telehealth, Personal Health, Rating & Shopping, Health Information Management, Revenue Cycle Management, Service Providers and Security. Click here to see our complete list of technologies.
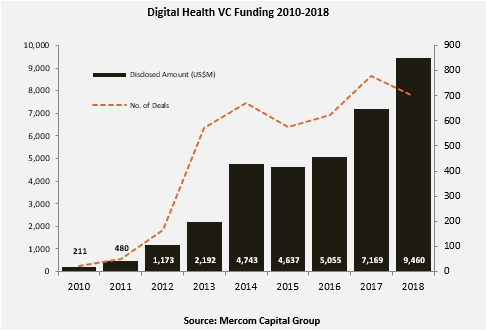
Global venture capital (VC) funding in digital health, including private equity and corporate venture capital, saw another record-breaking year in 2018 with $9.5 billion raised in 698 deals, a 32 percent increase from the previous record set in 2017 of $7.2 billion in 778 deals. Total corporate funding for Digital Health companies – including debt and public market financing – reached $13 billion in 2018, a 58 percent increase from the $8.2 billion raised in 2017.
Since 2010, digital health companies have received $35 billion in VC funding in over 4,000 deals and almost $12 billion in debt and public market financing (including IPOs), bringing the cumulative funding total for the sector to $47 billion.
“Venture capital funding in Digital Health hit another high with almost $10 billion raised. Venture capitalists’ love of digital health companies is evident, but Wall Street is not yet convinced as more than 60 percent of publicly-traded digital health stocks traded below the S&P 500 in 2018,” commented Raj Prabhu, CEO and Co-Founder of Mercom Capital Group. “Funding deals every year have significantly outpaced M&A and IPO activity and exits continue to be a big challenge for digital health companies,” said Prabhu.
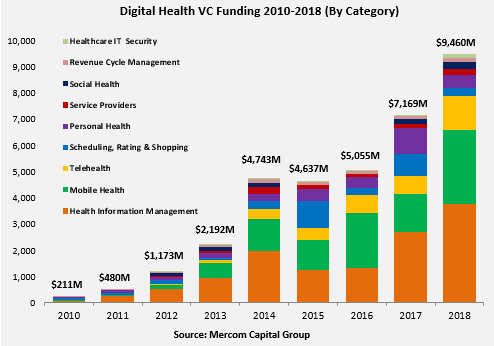
Consumer-centric companies brought in $5.2 billion in 447 deals in 2018, up 24 percent from $4.2 billion raised in 514 deals in 2017. Practice-centric companies raised close to $4.3 billion in 251 deals in 2018, a 43 percent increase compared to the $3 billion raised in 264 deals in 2017.
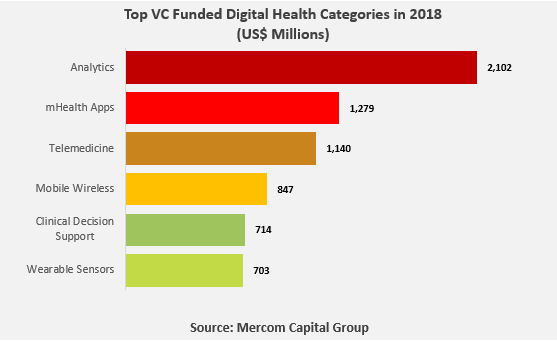
The highest funded categories in 2018 included: Data Analytics with $2.1 billion, mHealth Apps with $1.3 billion, Telemedicine with $1.1 billion, Mobile Wireless Technology companies with $847 million, Clinical Decision Support with $714 million, and Wearable Sensors Technology companies with $703 million.
There were 223 M&A transactions in 2018, compared to the 203 transactions in 2017. There were 18 companies that participated in multiple transactions in 2018.
mHealth Apps were the most acquired category in 2018 with 32, followed by Data Analytics companies with 27 transactions, and companies offering Practice Management Solutions with 22 transactions.
The top five disclosed M&A transactions in 2018 were: Veritas Capital and Elliott Management’s acquisition of athenahealth for $5.5 billion, Platinum Equity’s acquisition of LifeScan for $2.1 billion, Vista Equity Partners’ acquisition of MINDBODY for $1.9 billion, Roche’s acquisition of Flatiron Health for $1.9 billion, Inovalon’s acquisition of ABILITY Network for $1.2 billion, Veritas Capital’s acquisition of General Electric’s (GE) Healthcare IT division for $1 billion, and 3M’s acquisition of M*Modal for $1 billion.
The Q4 and Annual 2018 Digital Health (Healthcare IT) Funding and M&A Report also contains year-over-year (YoY) and quarter-over-quarter (QoQ) information on market activity displayed in easy-to-digest charts, graphs and tables, as well as data-driven analysis covering:
- Venture capital (VC) funding deals, including top investors, QoQ trends, and charts and graphs broken down by technology and stage;
- Practice-focused technology and subgroups;
- Consumer-focused technology and subgroups;
- VC funding by country and U.S. state;
- VC funding trends in early stage deals (below $2 million) and trends in deals over $2 million;
- Debt and public market financing deals;
- Mergers and acquisitions (M&A), including QoQ trends, a breakdown of charts and graphs by technology and geography;
- New Healthcare IT funds
This report also contains comprehensive lists of all announced Q4 2018:
- VC deals with investors and transaction details;
- Debt and public market financing deals and investors;
- M&A transactions and acquirers.
This report is 141 pages in length, contains 105 charts, graphs and tables, and covers 490 investors and companies.
RELATED PRODUCTS
Other reports you may be interested in
Venture Capital Funding
in Digital Health Sector
Reaches $15 Billion in 1H 2021
Venture Capital Funding
in Digital Health Sector
Reaches $7.2 Billion in Q1 2021
Bundle and Save ~20%
Get Quarterly Reports + The Annual Wrap
- Claim Your Deal!
Venture Capital Funding
in Digital Health Sector
Reaches $14.8 Billion in 2020
Digital Health VC Funding Hits
$10.3 Billion in 9M 2020
- Get the Details!
Digital Health/Healthcare IT VC Funding Hits
$6.3 Billion in 1H 2020
- Get the Details!
Bundle and Save ~20%
Get Quarterly Reports + The Annual Wrap
- Claim Your Deal!
Venture Capital Funding
in Digital Health Sector
Reaches $3.6 Billion in Q1 2020
Venture Capital Funding
in Digital Health Sector
Reaches $8.9 Billion in 2019
Digital Health VC Funding Hits
$7.2 Billion in 9M 2019
- Get the Details!