

1H and Q2 2021 Solar Funding and M&A Report
Price range: $299.00 through $499.00
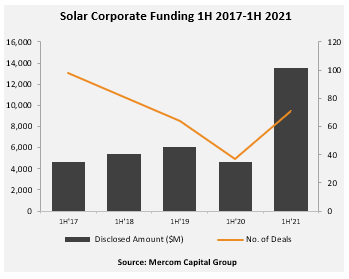
1H and Q2 2021 Total Corporate Funding
Totals $13.5 Billion
– See the Details!
Click here to download the Executive Summary.
Total corporate funding (including venture capital funding, public market, and debt financing) in 1H of 2021 came to $13.5 billion compared to $4.6 billion in 1H 2020, a 193% year-over-year (YoY) increase.
“Funding was up across the board in the first half of 2021 compared to last year, which was severely affected by the pandemic. Corporate M&A activity was up significantly with solar developers expanding their pipelines, oil and gas companies diversifying into renewables, and funds buying up renewable assets. Solar project acquisitions reached a record high in Q2,” said Raj Prabhu, CEO of Mercom Capital Group. “The transition from fossil fuels to renewables and ESG investing trends made an impact on financing as well as M&A activity.”
In 1H 2021, venture capital (VC) funding was 680% higher, with $1.6 billion raised in 26 deals compared to the $210 million that went into 14 deals in the first half of 2020. The increase in VC funding activity in the first half resulted from some very large transactions, including Loanpal’s $800 million deal in the first quarter of 2021.
Announced debt financing activity in 1H 2021 ($8.2 billion in 32 deals) was 125% higher compared to the first half of 2020 when $3.7 billion was raised in 17 deals. Spurred by low-interest rates, a record $2 billion was raised through seven securitization deals in 1H 2021. Cumulatively, over $9 billion has been raised through securitization deals since 2013.
Solar project acquisitions in 1H 2021 reached 39.3 GW compared to 14.7 GW acquired in the same period last year.
There were 376 companies and investors covered in this 96-page report, which contains 83 charts, graphs, and tables.
Mercom Capital Group’s Quarterly Solar Funding and M&A Reports are comprehensive high-quality reports delivering superior insight, market trends, and analysis. These reports help bring clarity to professionals in the current financial landscape of the solar industry.
Also available:
Custom Excel Sheets with all transactions for the quarter, and
Custom Research with data from the past 5 years!
Contact us to learn more and get pricing!
Quarterly market and deal activity displayed in easy-to-digest charts, graphs, and tables, alongside data-driven analysis.
The report covers all types of deals and financing activity, including:
- Venture capital funding deals, including top investors, QoQ and YoY trends, and a breakdown of charts and graphs by technology, sector, stage, and country;
- Large-scale project funding deals, including top investors, QoQ and YoY trends and breakdown charts and graphs by technology and country;
- Public market financing, including equity financing, private placements, and rights issues;
- Debt and other funding deals, as well as QoQ and YoY trends;
- Third-party residential/commercial project funds;
- Large-scale project acquisitions and active project acquirers;
- Large-scale project announcements in various levels of development throughout the world;
- Mergers and acquisitions (M&A), including QoQ and YoY trends, a breakdown of charts and graphs by technology and sector, as well as project M&A activity;
- New cleantech and solar funds;
- New large-scale project announcements;
- Large-scale project costs per MW.
This report also contains comprehensive lists of all announced Q2:
- VC funding, debt financing, public equity financing, and project funding deals;
- VC and project funding investors;
- M&A transactions;
- Project acquisitions by amounts and megawatts;
- M&A, and project M&A transactions;
- Large-scale project announcements.
Mercom’s comprehensive report covers deals of all sizes across the globe. Have questions about the report? Email us here.
RELATED PRODUCTS
Other reports you may be interested in
Q1 2026 Total Solar Corporate Funding
Totals $11 Billion
Bundle and Save 20%
Get Q1, Q2, Q3, and Q4 + Annual 2026 Wrap Up
9M and Q3 2025 Total Smart Grid Corporate Funding
Totals $2.8 Billion
9M and Q3 2025 Total Energy Storage Corporate Funding
Totals $11.2 Billion
9M 2025 Total Corporate Funding
Totals $17.3 Billion
1H and Q2 2025 Total Corporate Funding
Totals $10.8 Billion
Q1 2025 Total Corporate Funding
Totals $4.1 Billion
Bundle and Save 20%
Get Q1, Q2, Q3, and Q4 + Annual 2025 Wrap Up
Q4 2024 Annual Corporate Funding
Totals $26.3 Billion