

1H and Q2 2020 Funding and M&A Report for Storage, Grid & Efficiency
Price range: $299.00 through $399.00
A Combined $858 million was raised in 1H 2020
– Get the Report!
Click here to download our 1H and Q2 2020 Funding and M&A Executive Summary on Battery Storage, Smart Grid, and Efficiency.
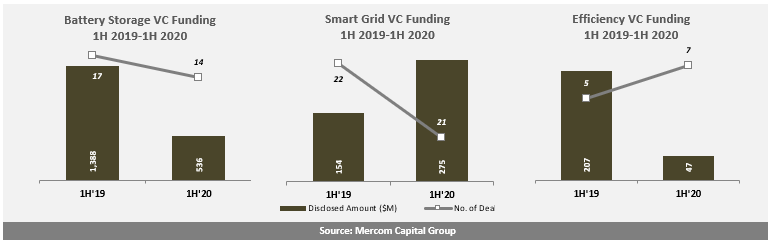
Mercom found that in the first half (1H) of 2020, $858 million was raised by Battery Storage, Smart Grid, and Efficiency companies compared to $1.8 billion in 1H 2019.
Battery Storage
VC funding in Battery Storage companies in 1H 2020 was down by 61%, with $536 million in 14 deals compared to $1.4 billion in 17 deals in 1H 2019.
A total of 26 VC investors participated in Battery Storage funding in 1H 2020.
In 1H 2020 there were a total of eight (all undisclosed) Battery Storage M&A transactions compared to six transactions (one disclosed) in 1H 2019.
Smart Grid
VC funding in Smart Grid companies in 1H 2020 was 79% higher with $275 million compared to the $154 million raised in 1H 2019.
A total of 44 VC investors participated in Smart Grid funding in 1H 2020.
In 1H 2020, there were a total of six Smart Grid M&A transactions (all undisclosed) compared to 18 transactions (one disclosed) in 1H 2019.
Efficiency
VC funding for Energy Efficiency companies in 1H 2020 was 77% lower with $47 million compared to the $207 million raised in 1H 2019.
A total of 17 VC investors participated in Energy Efficiency funding in 1H 2020.
In 1H 2020 there was one disclosed Efficiency M&A transaction compared to eight transactions (two disclosed) in 1H 2019.
Mercom Capital Group’s Battery Storage, Smart Grid, and Efficiency Funding and M&A Reports are comprehensive high-quality reports delivering superior insight, market trends and analysis. These reports help bring clarity to professionals in the current financial landscape of the smart grid industry.
The Quarterly Funding and M&A Reports contain QoQ information on market activity displayed in easy-to-digest charts, graphs and tables, as well as data-driven analysis covering:
- VC and M&A trends and charts for 1H 2020
- Venture capital funding deals including top investors, QoQ trends, and a breakdown of charts and graphs by stage;
- VC funding by technology;
- Debt and other funding deals;
- Mergers and Acquisitions (M&A) including QoQ trends, with charts and graphs by technologies;
- Battery and storage funding deals;
- Smart Grid funding deals;
- Energy Efficiency funding deals;
- New cleantech funds;
This report also contains comprehensive lists of all announced deals and transactions during the quarter, including:
- VC deals and investors;
- M&A transactions and acquirers;
- New cleantech funds.
There were 109 companies and investors covered in this report. The report is 95 pages in length and contains 94 charts, graphs and tables.
RELATED PRODUCTS
Other reports you may be interested in
Corporate funding for smart grid companies totaled $1.1 billion in Q1 2026
Corporate funding for energy storage companies totaled $2.3 billion in Q1 2026
Receive 31% Off the Entire 2026 Bundle
Purchase the Entire 2026 Bundle
Receive ~20% Off the Entire 2026 Bundle
9M and Q3 2025 Total Energy Storage Corporate Funding
Totals $11.2 Billion
Corporate funding for smart grid companies totaled $1.4 billion in 1H 2025
Corporate funding for energy storage companies totaled $9.1 billion in 1H 2025