

1H and Q2 2025 Funding and M&A Report for Energy Storage
Price range: $249.00 through $349.00
Click here to download our 1H and Q2 2025 Funding and M&A Executive Summary on Energy Storage.
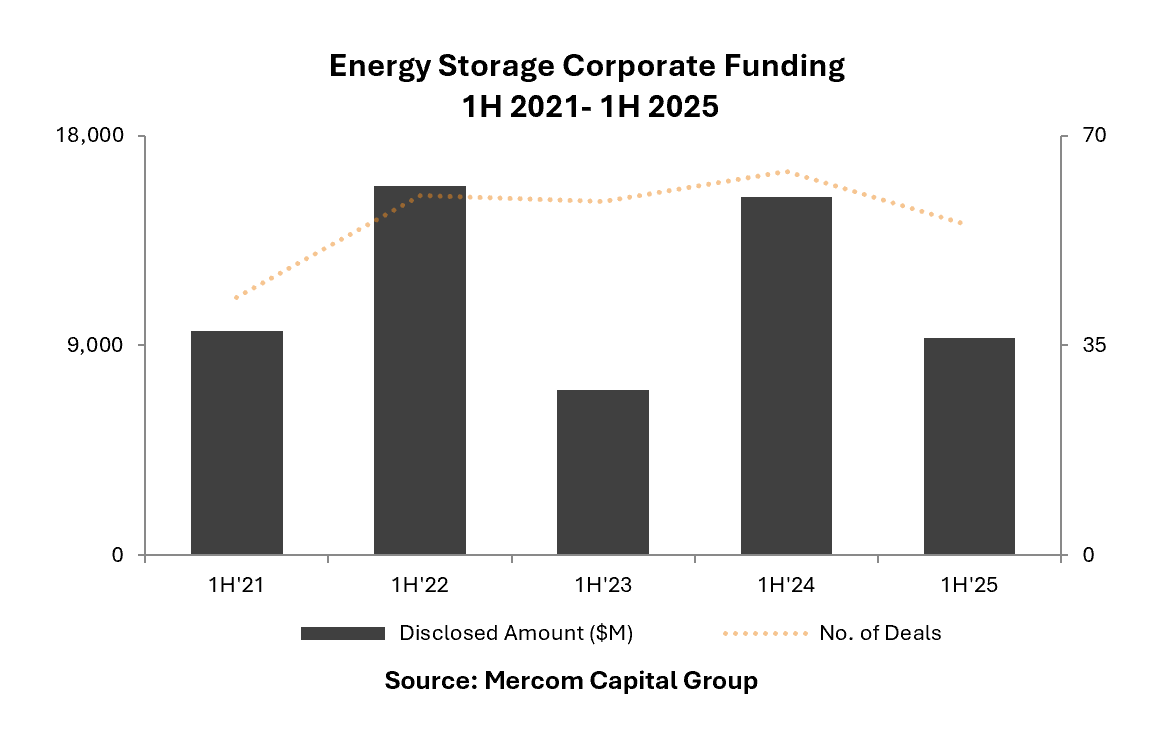
Corporate funding for energy storage companies in 1H 2025 reached $9.1 billion across 55 deals, a 41% decrease year-over-year(YoY) compared to $15.4 billion in 64 deals in 1H 2024, as policy uncertainties and tariff announcements negatively impacted financing activities.
VC funding for Energy Storage companies in 1H 2025 came to $1.7 billion in 36 deals, a 29% decrease YoY compared to $2.4 billion in 48 deals in 1H 2024.
Energy Storage Downstream companies received the most VC funding in 1H 2025. Other top-funded categories included Materials and Components, Energy Storage Systems, Sodium-based batteries, and Thermal Energy Storage companies.
Announced debt and public market financing for Energy Storage companies in 1H 2025 came to $7.4 billion in 19 deals, a 43% decrease YoY compared to $13 billion in 16 deals in 1H 2024.
In the first half of 2025, there were three M&A transactions in energy storage sector, down from 14 in the first half of 2024.
Meanwhile, the first half of 2025 saw 31 energy storage project M&A transactions, a 138% increase compared to 13 transactions in the same period of 2024.
Mercom Capital Group’s Energy Storage Funding and M&A Reports are comprehensive high-quality reports delivering superior insight, market trends and analysis. These reports help bring clarity to professionals in the current financial landscape of the smart grid industry.
The Quarterly Funding and M&A Reports contain quarter-over-quarter (QoQ) information on market activity displayed in easy-to-digest charts, graphs and tables, as well as data-driven analysis covering:
- Venture capital funding deals including top investors, QoQ trends, and a breakdown of charts and graphs by stage;
- VC funding by technology;
- Debt and other funding deals;
- Mergers and Acquisitions (M&A) including QoQ trends, with charts and graphs by technologies;
- Battery and storage funding deals;
- New cleantech funds;
This report also contains comprehensive lists of all announced deals and transactions during the quarter, including:
- VC deals and investors;
- M&A transactions and acquirers;
- New cleantech funds.
There were 172 companies and investors covered in this report. The report is 70 pages in length and contains 46 charts, graphs and tables.
RELATED PRODUCTS
Other reports you may be interested in
Corporate funding for smart grid companies totaled $1.4 billion in 1H 2025
Corporate funding for energy storage companies totaled $2.2 billion in Q1 2025
Corporate funding for smart grid companies totaled $530 million in Q1 2025
Receive 31% Off the Entire 2025 Bundle
– Save Today!