2017 Q4 and Annual Solar Funding and M&A Report
$599.00 – $799.00
Strong fourth quarter boosts
2018 solar funding total to $12.8 billion
– See the Deals!
Click Here to download our 2017 Q4 and Annual Solar Funding and M&A Executive Summary.
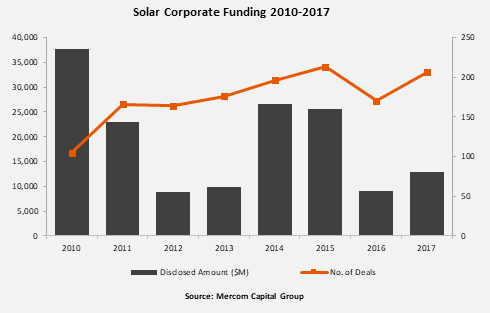
Total global corporate funding for the solar sector, including venture capital/private equity (VC), debt financing, and public market financing, reached $12.8 billion in 2017, a 41 percent increase from the $9.1 billion raised in 2016.

“A strong fourth quarter pushed overall funding higher in 2017. Higher installation levels around the world, the lack of threat to the solar investment tax credit, lower than expected tariff recommendation by U.S. ITC, strong debt financing activity, and over a billion dollars in securitization deals helped the solar industry have a much better year in terms of financial activity compared to 2016. After several challenging years, most of the solar securities were up in 2017 reflecting overall positive sentiments around the solar industry even as several Chinese manufacturers decided to go private. Of course, all this could change swiftly if U.S. President Trump decides to impose higher tariffs in the trade case,” commented Raj Prabhu, CEO and Co-Founder of Mercom Capital Group.
Global VC investments came to $1.6 billion in 99 deals in 2017, up 30 percent from the $1.3 billion raised by 78 deals in 2016, led by several large private equity deals in India.
Solar downstream companies accounted for 85 percent of total VC funding in 2017, accounting for $1.4 billion of the total $1.6 billion raised. Thin-film companies brought in $106 million while service providers raised $47 million.
The top VC/PE deals reported in 2017 included a deal for $200 million signed by Lightsource Renewable Energy. ReNew Power also had two deals worth $200 million each, followed by Greenko Energy Holdings which raised $155 million. Hero Future Energies raised $125 million and CleanMax Solar raised $100 million. Overall, five of the top six solar VC funding deals in 2017 came from India.
Large-scale project funding announced in 2017 reached a $14 billion raised in 167 deals, compared to $9.4 billion raised in 133 deals during 2016. A total of 161 investors funded about 20.5 GW of large-scale solar projects in 2017 compared to 5.9 GW funded by 153 investors in 2016.
The top investors in large-scale projects included Clean Energy Finance Corporation (CEFC), which invested in 13 projects, followed by Santander with eight deals, and Commonwealth Bank of Australia and Siemens Financial Services with six deals each.
There were 71 corporate M&A transactions in the solar sector in 2017, up slightly from 68 transactions recorded in 2016. Solar downstream companies were involved in 51 of these transactions. Engie acquired three companies while BayWa, Brookfield Asset Management, Horizon Solar Power, Siva Power, Solar Spectrum, and Sonnedix acquired two companies each. The largest and the most notable transaction in 2017 was the $1.6 billion acquisition of FTP Power (sPower) by AES and Alberta Investment Management (AIMCo) from Fir Tree Partners.
Project acquisitions jumped up 67 percent as a record 228 large-scale solar projects with a combined capacity of more than 20.4 GW were acquired in 2017, compared to 2016 when 12.2 GW changed hands in 218 transactions.
Mercom also tracked 187 large-scale project announcements across the globe that totaled 10.6 GW in Q4 2017 and 922 large-scale project announcements totaling 50.1 GW for all of 2017.
Mercom Capital Group’s Quarterly Solar Funding and M&A Reports are comprehensive high-quality reports that deliver superior insight, market trends and analysis. These reports give professionals clarity about the current financial landscape of the solar industry.
Also available:
Custom Excel Sheets with all transactions for the quarter, and
Custom Research with data from the past 5 years!
Contact us to learn more and get pricing!
The Q4 and Annual 2017 Solar Funding and M&A report contains year-over-year (YoY) and quarter-over-quarter (QoQ) information on market activity displayed in easy-to-digest charts, graphs, and tables, as well as data-driven analysis covering:
- Venture capital funding deals, including top investors, YoY and QoQ trends, and a breakdown of charts and graphs by technology, sector, stage and country;
- Large-scale project funding deals, including top investors,YoY and QoQ trends and breakdown charts and graphs by technology and country;
- Public market financings, including equity financings, private placements and rights issues;
- Debt and other funding deals, as well as YoY and QoQ trends;
- Securitization deals;
- Residential and commercial project funds;
- Large-scale project acquisitions and active project acquirers;
- Large-scale project announcements in various levels of development throughout the world;
- Mergers and acquisitions (M&A), including YoY and QoQ trends, a breakdown of charts and graphs by technology and sector, as well as project M&A activity;
- New solar and cleantech funds;
- IPOs, new public listings;
- New large-scale project announcements;
- Large-scale project costs per MW.
This report also contains comprehensive lists of all announced Q4:
- VC funding, debt financing, public equity financings, and project funding deals;
- VC and project funding investors;
- M&A transactions;
- Project acquisitions by amounts and megawatts;
- M&A and project M&A transactions;
- Large-scale project announcements.
There are 598 companies and investors covered in this report. It is 148 pages long and contains 115 charts, graphs, and tables.
Mercom’s comprehensive report covers deals of all sizes across the globe. Have questions about the report? Email us here.
