

1H and Q2 2024 Funding and M&A Report for Storage & Grid
Price range: $299.00 through $499.00
Click here to download our 1H and Q2 2024 Funding and M&A Executive Summary on Energy Storage and Smart Grid.
Energy Storage
Corporate funding for Energy Storage companies in 1H 2024 came to $15.4 billion in 64 deals, a 117% increase year-over-year (YoY) compared to $7.1 billion in 59 deals in 1H 2023.
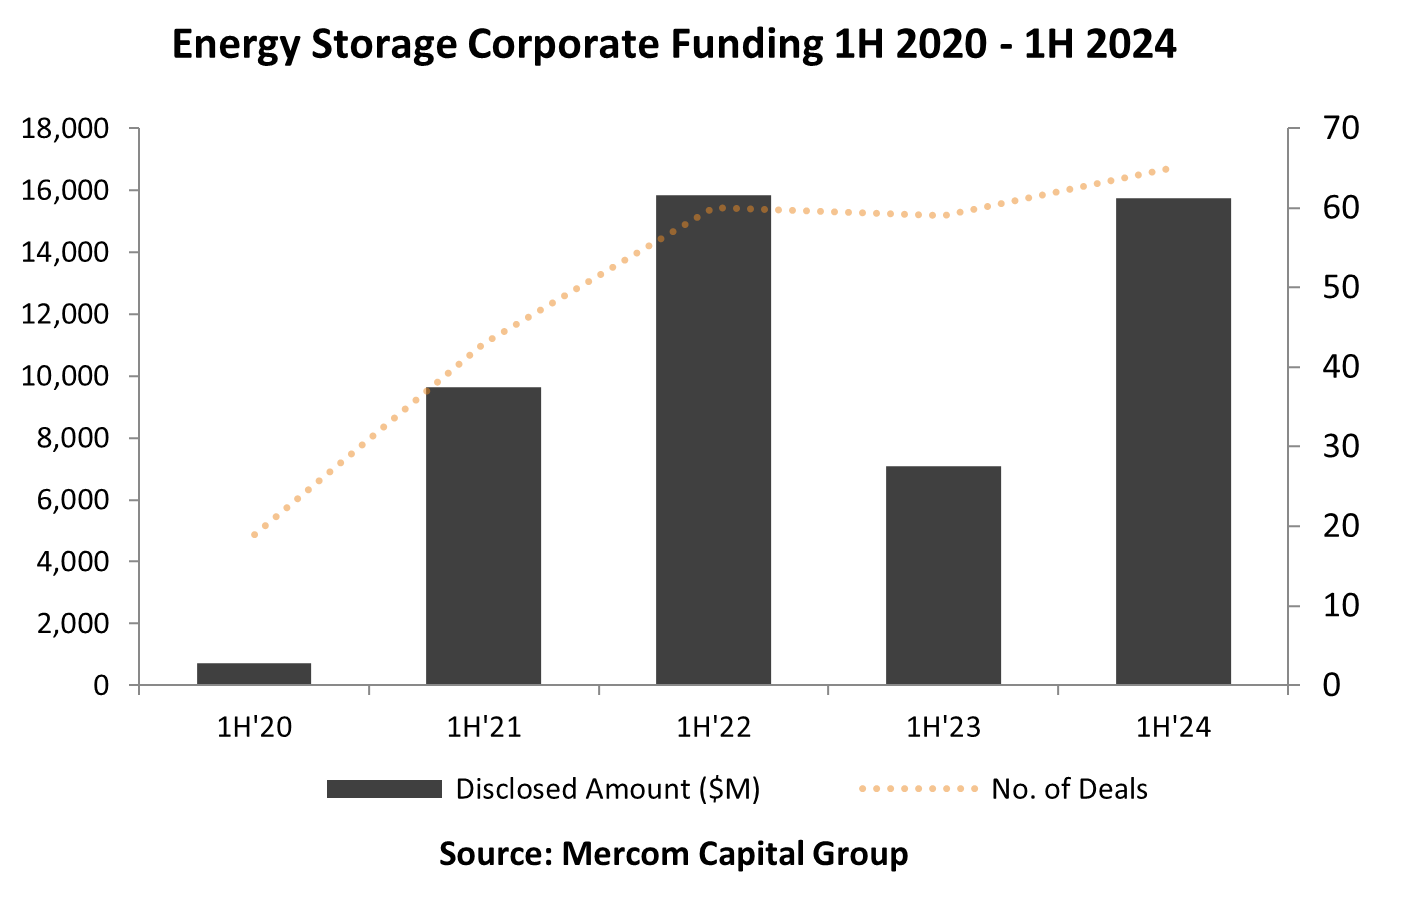
VC funding for Energy Storage companies in 1H 2024 came to $2.4 billion in 48 deals, a 37% decrease YoY compared to $3.8 billion in 43 deals in 1H 2023.
130 VC investors participated in Energy Storage funding this quarter.
Announced debt and public market financing for Energy Storage companies in 1H 2024 came to $13 billion in 16 deals, a 294% increase YoY compared to $3.3 billion in 16 deals in 1H 2023.
In 1H 2024, there were 14 M&A transactions compared to eight (8) in 1H 2023.
Smart Grid
Corporate funding for Smart Grid in 1H 2024 totaled $1.6 billion in 36 deals, 11% lower YoY compared to $1.8 billion raised in 33 deals in 1H 2023.
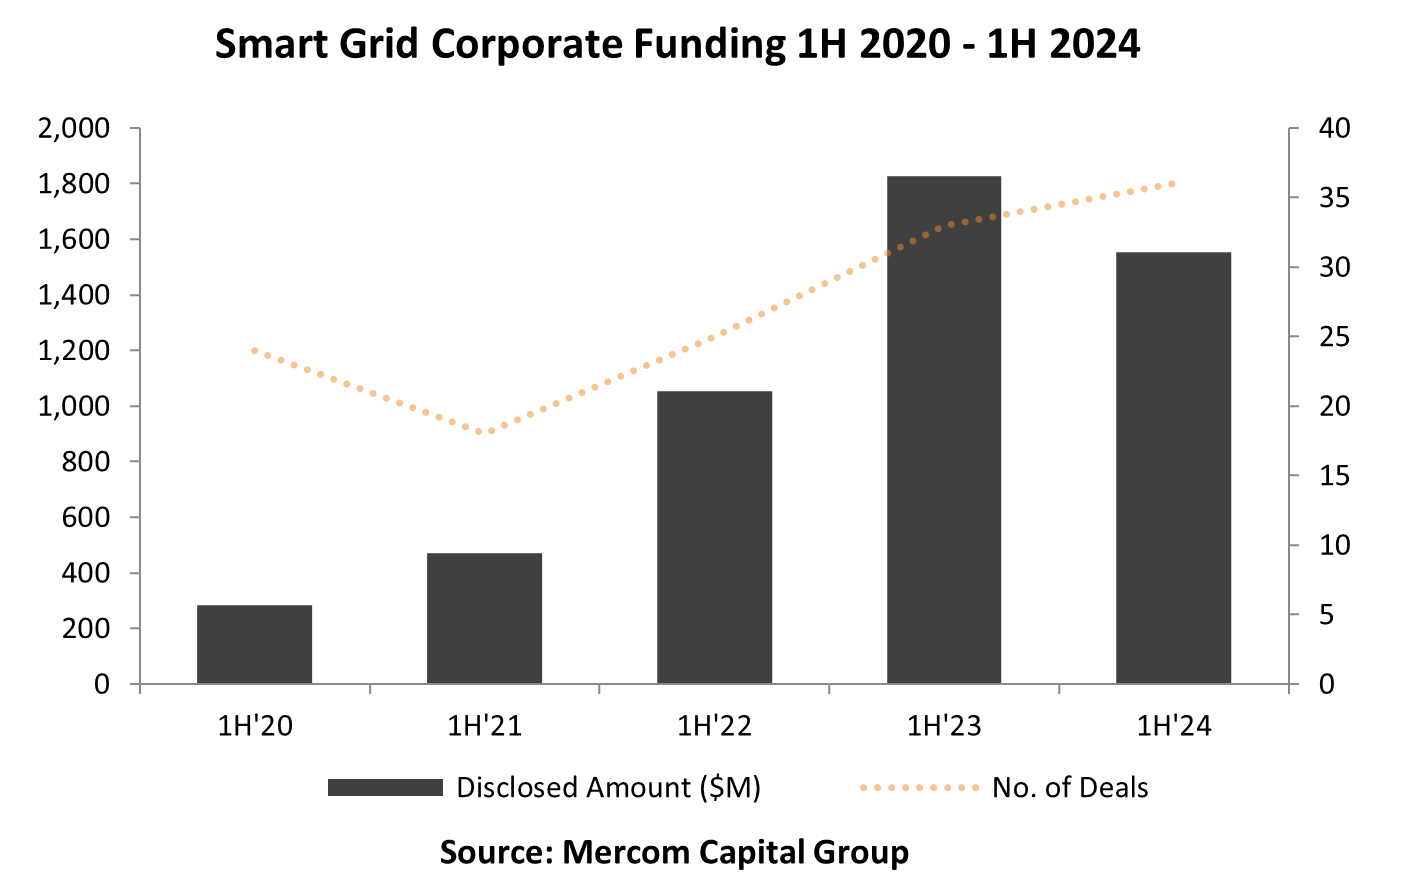
VC funding for Smart Grid companies in 1H 2024 totaled $1.2 billion in 29 deals, 22% higher YoY compared to $986 million raised in 26 deals in 1H 2023.
53 participated in VC funding this quarter.
Announced debt and public market financing for Smart Grid technology companies totaled $321 million in seven deals in 1H 2024 compared to $839 million in the same number of deals in 1H 2023.
Mercom Capital Group’s Energy Storage and Smart Grid Funding and M&A Reports are comprehensive high-quality reports delivering superior insight, market trends and analysis. These reports help bring clarity to professionals in the current financial landscape of the smart grid industry.
The Quarterly Funding and M&A Reports contain quarter-over-quarter (QoQ) information on market activity displayed in easy-to-digest charts, graphs and tables, as well as data-driven analysis covering:
- Venture capital funding deals including top investors, QoQ trends, and a breakdown of charts and graphs by stage;
- VC funding by technology;
- Debt and other funding deals;
- Mergers and Acquisitions (M&A) including QoQ trends, with charts and graphs by technologies;
- Energy and storage funding deals;
- Smart Grid funding deals;
- Energy Efficiency funding deals;
- New cleantech funds;
This report also contains comprehensive lists of all announced deals and transactions during the quarter, including:
- VC deals and investors;
- M&A transactions and acquirers;
- New cleantech funds.
There were 333 companies and investors covered in this report. The report is 115 pages in length and contains 79 charts, graphs and tables.
RELATED PRODUCTS
Other reports you may be interested in
Corporate funding for smart grid companies totaled $1.4 billion in 1H 2025
Corporate funding for energy storage companies totaled $9.1 billion in 1H 2025
Corporate funding for energy storage companies totaled $2.2 billion in Q1 2025
Corporate funding for smart grid companies totaled $530 million in Q1 2025