

Q1 2022 Solar Funding and M&A Report
Price range: $299.00 through $499.00
Q1 2022 Total Corporate Funding
Totals $7.5 Billion
– Get the Report
Click here to download the Executive Summary.
Total corporate funding—including venture capital (VC) funding, public market, and debt financing—into the solar sector in Q1 2022 came to $7.5 billion in 49 deals, a 51% increase compared to $5 billion raised in 32 deals in Q4 2021. However, funding was lower by 7% year-over-year (YoY) compared to Q1 2021.
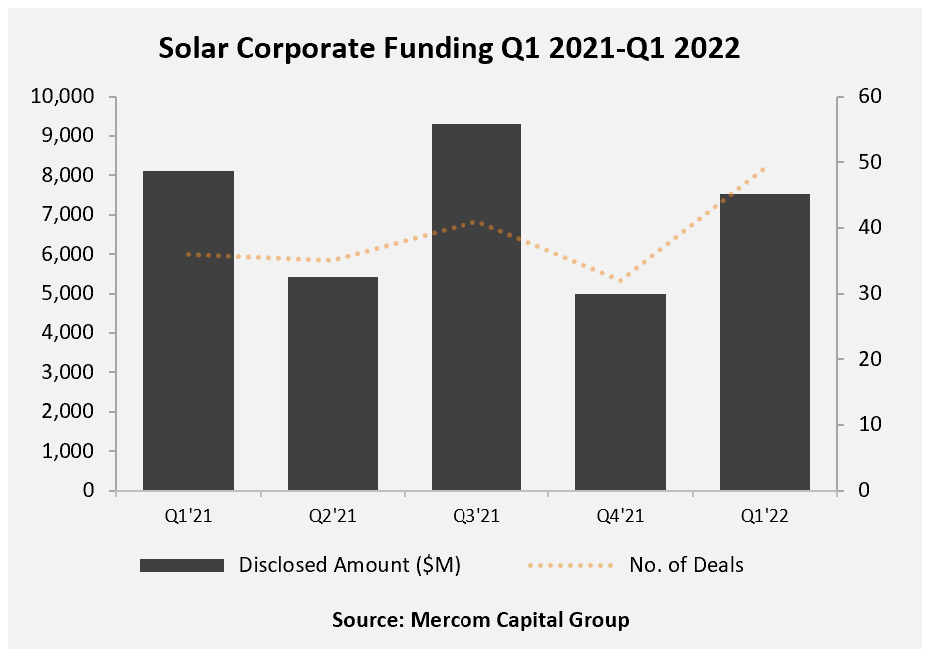
Global VC funding for the solar sector in Q1 2022 came to $1.2 billion in 26 deals, a 45% decrease compared to $2.2 billion raised in 19 deals in Q4 2021. Year-over-year funding was 19% higher compared to Q1 2021.
Announced debt financing for the solar sector in Q1 2022 totaled $3.8 billion, a 137% increase compared to Q4 2021 when $1.6 billion was raised. However, debt financing was down 12% YoY.
A total of 29 solar M&A transactions were recorded in Q1 2022 compared to 43 in Q4 2021. In a YoY comparison, there were 20 solar M&A transactions in Q1 2021.
Large-scale solar project acquisition activity remained strong, with over 23 GW of solar projects acquired in Q1 2022 compared to 13.1 GW in Q4 2021. Year-over-year, 15 GW were acquired in Q1 2021. Large-scale solar project acquisitions in Q1 2022 were the second highest recorded to date.
There were 375 companies and investors covered in this 89-page report, which contains 67 charts, graphs, and tables.
Mercom Capital Group’s Quarterly Solar Funding and M&A Reports are comprehensive high-quality reports delivering superior insight, market trends, and analysis. These reports help bring clarity to professionals in the current financial landscape of the solar industry.
Also available:
Custom Excel Sheets with all transactions for the quarter, and
Custom Research with data from the past 5 years!
Contact us to learn more and get pricing!
Quarterly market and deal activity displayed in easy-to-digest charts, graphs, and tables, alongside data-driven analysis.
The report covers all types of deals and financing activity, including:
- Venture capital funding deals, including top investors, QoQ and YoY trends, and a breakdown of charts and graphs by technology, sector, stage, and country;
- Large-scale project funding deals, including top investors, QoQ and YoY trends and breakdown charts and graphs by technology and country;
- Public market financing, including equity financing, private placements, and rights issues;
- Debt and other funding deals, as well as QoQ and YoY trends;
- Third-party residential/commercial project funds;
- Large-scale project acquisitions and active project acquirers;
- Large-scale project announcements in various levels of development throughout the world;
- Mergers and acquisitions (M&A), including QoQ and YoY trends, a breakdown of charts and graphs by technology and sector, as well as project M&A activity;
- New cleantech and solar funds;
- New large-scale project announcements;
- Large-scale project costs per MW.
This report also contains comprehensive lists of all announced Q1:
- VC funding, debt financing, public equity financing, and project funding deals;
- VC and project funding investors;
- M&A transactions;
- Project acquisitions by amounts and megawatts;
- M&A, and project M&A transactions;
- Large-scale project announcements.
Mercom’s comprehensive report covers deals of all sizes across the globe. Have questions about the report? Email us here.
RELATED PRODUCTS
Other reports you may be interested in
Q1 2026 Total Solar Corporate Funding
Totals $11 Billion
Bundle and Save 20%
Get Q1, Q2, Q3, and Q4 + Annual 2026 Wrap Up
9M and Q3 2025 Total Smart Grid Corporate Funding
Totals $2.8 Billion
9M and Q3 2025 Total Energy Storage Corporate Funding
Totals $11.2 Billion
9M 2025 Total Corporate Funding
Totals $17.3 Billion
1H and Q2 2025 Total Corporate Funding
Totals $10.8 Billion
Q1 2025 Total Corporate Funding
Totals $4.1 Billion
Bundle and Save 20%
Get Q1, Q2, Q3, and Q4 + Annual 2025 Wrap Up
Q4 2024 Annual Corporate Funding
Totals $26.3 Billion