

Q1 2020 Solar Funding and M&A Report
Price range: $299.00 through $499.00
Q1 2020 Total Corporate Funding
Totals $1.9 Billion
– See the Details!
Click here to download the Executive Summary.
Total corporate funding, including venture capital funding, public market, and debt financing into the solar sector in Q1 2020 came to $1.9 billion, 31% lower compared to the $2.8 billion raised in Q1 2019.
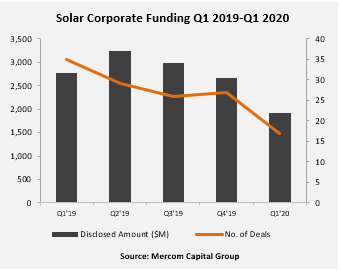
“Funding levels dropped in Q1 as the Coronavirus pandemic brought the global economy to a halt. Most large economies are shut down and there is minimal activity in solar markets. Solar project M&A was the bright spot in this time of uncertainty, proving once again that solar is a safe long-term bet. The worst maybe yet to come, but hope is that activity picks up in the second half of the year,” said Raj Prabhu, CEO of Mercom Capital Group.
Global VC funding for the solar sector in Q1 2020 reached $145 million in nine deals compared to $176 million raised in 13 deals in Q1 2019.
Announced debt financing in Q1 2020 totaled to $1.8 billion in seven deals compared to $2.4 billion in 19 deals in Q1 2019. One securitization deal was recorded in the quarter.
There were 12 solar M&A transactions in Q1 2020 compared 18 solar M&A transactions in Q1 2019. Of the 12 solar M&A transactions announced in Q1 2020, 11 involved Solar Downstream companies. There was one transaction involving a module manufacturer.
Over 12 GW of solar projects were acquired in Q1 2020 compared to 10.1 GW in Q4 2019. In a YoY comparison, 5.9 GW were acquired in Q1 2019.
There were 230 companies and investors covered in this 75 pages report, which contains 66 charts, graphs, and tables.
Mercom Capital Group’s Quarterly Solar Funding and M&A Reports are comprehensive high-quality reports delivering superior insight, market trends and analysis. These reports help bring clarity to professionals in the current financial landscape of the solar industry.
Also available:
Custom Excel Sheets with all transactions for the quarter, and
Custom Research with data from the past 10 years!
Contact us to learn more and get pricing!
Quarterly market and deal activity displayed in easy-to-digest charts, graphs and tables, alongside data-driven analysis.
The report covers all types of deals and financing activity, including:
- Venture capital funding deals, including top investors, QoQ and YoY trends, and a breakdown of charts and graphs by technology, sector, stage and country;
- Large-scale project funding deals, including top investors, QoQ and YoY trends and breakdown charts and graphs by technology and country;
- Public market financing, including equity financing, private placements and rights issues;
- Debt and other funding deals, as well as QoQ and YoY trends;
- Third-party residential/commercial project funds;
- Large-scale project acquisitions and active project acquirers;
- Large-scale project announcements in various levels of development throughout the world;
- Mergers and acquisitions (M&A), including QoQ and YoY trends, a breakdown of charts and graphs by technology and sector, as well as project M&A activity;
- New cleantech and solar funds;
- New large-scale project announcements;
- Large-scale project costs per MW.
This report also contains comprehensive lists of all announced Q1:
- VC funding, debt financing, public equity financing, and project funding deals;
- VC and project funding investors;
- M&A transactions;
- Project acquisitions by amounts and megawatts;
- M&A, and project M&A transactions;
- Large-scale project announcements.
Mercom’s comprehensive report covers deals of all sizes across the globe. Have questions about the report? Email us here.
RELATED PRODUCTS
Other reports you may be interested in
1H 2026 Corporate Funding for solar companies
totals $16.9 billion
Q1 2026 Total Solar Corporate Funding
Totals $11 Billion
Bundle and Save 20%
Get Q1, Q2, Q3, and Q4 + Annual 2026 Wrap Up
9M and Q3 2025 Total Smart Grid Corporate Funding
Totals $2.8 Billion
9M 2025 Total Corporate Funding
Totals $17.3 Billion
1H and Q2 2025 Total Corporate Funding
Totals $10.8 Billion
Q1 2025 Total Corporate Funding
Totals $4.1 Billion
Bundle and Save 20%
Get Q1, Q2, Q3, and Q4 + Annual 2025 Wrap Up
Q4 2024 Annual Corporate Funding
Totals $26.3 Billion