

Annual and Q4 2021 Solar Funding and M&A Report
Price range: $599.00 through $799.00
2021 Corporate Funding
was the Highest Since 2010 with $27.8 Billion
– Get the Report
Click here to download the Executive Summary.
Total corporate funding across the globe in the solar sector, including venture capital and private equity (VC), debt financing, and public market financing, came to $27.8 billion, a 91% increase compared to the $14.5 billion raised in 2020. Corporate funding in 2021 was the highest in ten years.
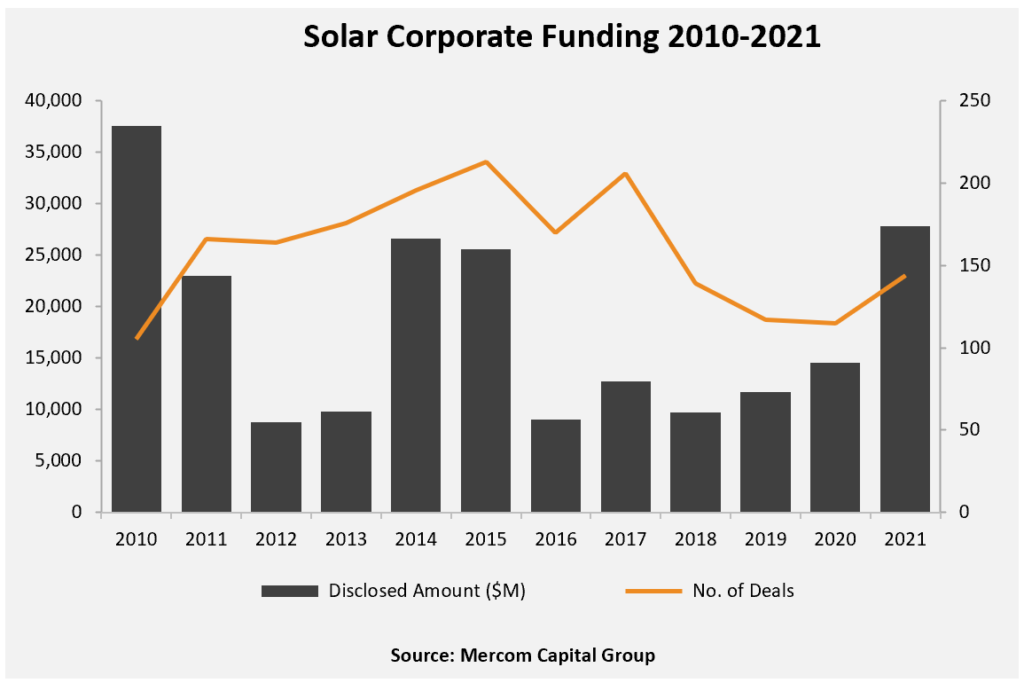
“2021 was the best year for solar corporate funding as well as mergers and acquisitions since 2010. Financing activity bounced back strongly following a COVID-19-affected 2020. There was more money than ever chasing deals and more demand than supply of attractive companies and assets as organizations and funds look to fulfill their ESG and clean energy mandates,” said Raj Prabhu, CEO of Mercom Capital Group.
Global venture capital and private equity funding in the solar sector in 2021 came to $4.5 billion, a 281% increase compared to the $1.2 billion in 2020.
In 2021, announced debt financing came to $15.8 billion, a 91% increase compared to $8.3 billion raised during 2020. Record securitization activity was a key contributor to the rise in debt financing activity during 2021, with $3.7 billion in 13 deals.
There were 280 large-scale solar project acquisitions in 2021 compared to 231 transactions in 2020. In 2021, the sector also saw the most project acquisition activity in terms of gigawatts, with more than 69 GW changing hands compared to 40 GW in 2020.
There were 367 companies and investors covered in this 131-page report, which contains 108 charts, graphs, and tables.
Mercom Capital Group’s Quarterly Solar Funding and M&A Reports are comprehensive high-quality reports delivering superior insight, market trends, and analysis. These reports help bring clarity to professionals in the current financial landscape of the solar industry.
Also available:
Custom Excel Sheets with all transactions for the quarter, and
Custom Research with data from the past 5 years!
Contact us to learn more and get pricing!
Quarterly market and deal activity displayed in easy-to-digest charts, graphs, and tables, alongside data-driven analysis.
The report covers all types of deals and financing activity, including:
- Venture capital funding deals, including top investors, QoQ and YoY trends, and a breakdown of charts and graphs by technology, sector, stage, and country;
- Large-scale project funding deals, including top investors, QoQ and YoY trends and breakdown charts and graphs by technology and country;
- Public market financing, including equity financing, private placements, and rights issues;
- Debt and other funding deals, as well as QoQ and YoY trends;
- Third-party residential/commercial project funds;
- Large-scale project acquisitions and active project acquirers;
- Large-scale project announcements in various levels of development throughout the world;
- Mergers and acquisitions (M&A), including QoQ and YoY trends, a breakdown of charts and graphs by technology and sector, as well as project M&A activity;
- New cleantech and solar funds;
- New large-scale project announcements;
- Large-scale project costs per MW.
This report also contains comprehensive lists of all announced Q4:
- VC funding, debt financing, public equity financing, and project funding deals;
- VC and project funding investors;
- M&A transactions;
- Project acquisitions by amounts and megawatts;
- M&A, and project M&A transactions;
- Large-scale project announcements.
Mercom’s comprehensive report covers deals of all sizes across the globe. Have questions about the report? Email us here.
RELATED PRODUCTS
Other reports you may be interested in
1H 2026 Corporate Funding for solar companies
totals $16.9 billion
Q1 2026 Total Solar Corporate Funding
Totals $11 Billion
Bundle and Save 20%
Get Q1, Q2, Q3, and Q4 + Annual 2026 Wrap Up
9M and Q3 2025 Total Smart Grid Corporate Funding
Totals $2.8 Billion
9M 2025 Total Corporate Funding
Totals $17.3 Billion
1H and Q2 2025 Total Corporate Funding
Totals $10.8 Billion
Q1 2025 Total Corporate Funding
Totals $4.1 Billion
Bundle and Save 20%
Get Q1, Q2, Q3, and Q4 + Annual 2025 Wrap Up
Q4 2024 Annual Corporate Funding
Totals $26.3 Billion