

9M and Q3 2021 Solar Funding and M&A Report
$299.00 – $499.00
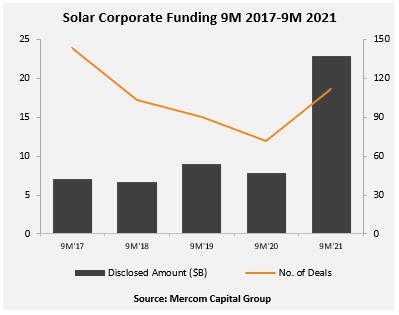
9M 2021 Corporate Funding
Totals $22.8 Billion
– See the Details!
Click here to download the Executive Summary.
Total corporate funding (including venture capital funding, public market, and debt financing) increased 190% in 9M 2021, with $22.8 billion in 112 deals compared to $7.9 billion in 72 deals in 9M 2020. Financing activity was up across the board, including venture capital, debt, and public market financing.
“Investment activity continues to be robust across the solar sector and not just compared to 2020 (because of COVID). This will end up as one of the best years for solar financing since 2010. As the push toward the energy transition picks up speed worldwide, solar – one of the mature renewable energy resources – is benefitting enormously. Solar project acquisitions in the first nine months of 2021 have already surpassed all of 2020,” said Raj Prabhu, CEO of Mercom Capital Group.
In 9M 2021, the solar sector brought in $2.2 billion in VC funding in 39 deals, 466% higher compared to $394 million in 29 deals in 9M 2020.
In Q3 2021, announced debt financing amounted to $6 billion in 18 deals, an increase of 54% compared to $3.9 billion raised in 18 deals in Q2 2021. Debt financing activity in Q3 2021 was 242% higher YoY compared to the $1.8 billion raised in 16 deals during Q3 2020.
Record securitization activity was a key contributor to the increase in debt financing activity during 9M 2021.
In 9M 2021, large-scale solar project acquisition activity was up 129% with 55.5 GW being acquired compared to 24.3 GW in 9M 2020. A total of 15.8 GW of solar projects were acquired in Q3 2021.
There were 339 companies and investors covered in this 95-page report, which contains 80 charts, graphs, and tables.
Mercom Capital Group’s Quarterly Solar Funding and M&A Reports are comprehensive high-quality reports delivering superior insight, market trends, and analysis. These reports help bring clarity to professionals in the current financial landscape of the solar industry.
Also available:
Custom Excel Sheets with all transactions for the quarter, and
Custom Research with data from the past 5 years!
Contact us to learn more and get pricing!
Quarterly market and deal activity displayed in easy-to-digest charts, graphs, and tables, alongside data-driven analysis.
The report covers all types of deals and financing activity, including:
- Venture capital funding deals, including top investors, QoQ and YoY trends, and a breakdown of charts and graphs by technology, sector, stage, and country;
- Large-scale project funding deals, including top investors, QoQ and YoY trends and breakdown charts and graphs by technology and country;
- Public market financing, including equity financing, private placements, and rights issues;
- Debt and other funding deals, as well as QoQ and YoY trends;
- Third-party residential/commercial project funds;
- Large-scale project acquisitions and active project acquirers;
- Large-scale project announcements in various levels of development throughout the world;
- Mergers and acquisitions (M&A), including QoQ and YoY trends, a breakdown of charts and graphs by technology and sector, as well as project M&A activity;
- New cleantech and solar funds;
- New large-scale project announcements;
- Large-scale project costs per MW.
This report also contains comprehensive lists of all announced Q3:
- VC funding, debt financing, public equity financing, and project funding deals;
- VC and project funding investors;
- M&A transactions;
- Project acquisitions by amounts and megawatts;
- M&A, and project M&A transactions;
- Large-scale project announcements.
Mercom’s comprehensive report covers deals of all sizes across the globe. Have questions about the report? Email us here.
RELATED PRODUCTS
Other reports you may be interested in
9M and Q3 2025 Total Smart Grid Corporate Funding
Totals $2.8 Billion
9M and Q3 2025 Total Energy Storage Corporate Funding
Totals $11.2 Billion
9M 2025 Total Corporate Funding
Totals $17.3 Billion
1H and Q2 2025 Total Corporate Funding
Totals $10.8 Billion
Q1 2025 Total Corporate Funding
Totals $4.1 Billion
Bundle and Save 20%
Get Q1, Q2, Q3, and Q4 + Annual 2025 Wrap Up