

9M and Q3 2024 Solar Funding and M&A Report
Price range: $299.00 through $499.00
Click here to download the Executive Summary.
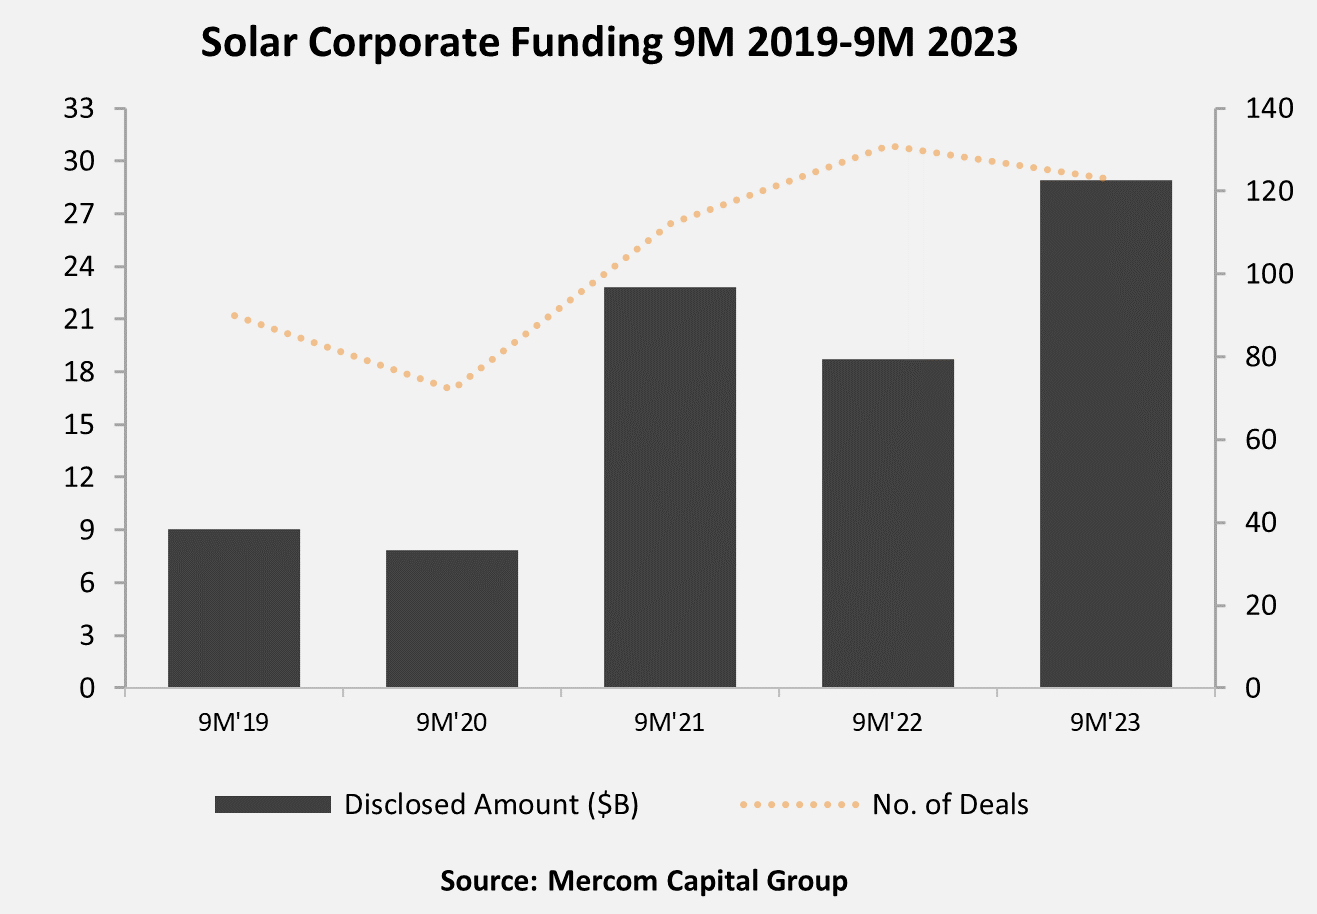
Total corporate funding, including venture capital (VC) funding, public market, and debt financing, in the first nine months (9M) of 2024 stood at $22.3 billion, 23% lower than the $28.9 billion raised in 9M 2023. The number of deals also decreased 6% year-over-year (YoY), with 117 deals in 9M 2024 compared to 124 deals during the same period last year.
“As we look at the financing activity in Q3 2024, it’s clear that the solar sector is grappling with significant uncertainties. Regulatory concerns around antidumping and countervailing duties and tariffs, the U.S. Section 45X guidance, potential policy shifts due to election outcomes, unpredictable global trade policies, supply chain disruptions, higher costs, tight labor markets, and ongoing project delays have all dampened investor confidence and delayed key investment decisions. While the recent 50 basis points rate cut is hopeful, the market needs more clarity and direction on future rate cuts to spark a resurgence in investment momentum,” said Raj Prabhu, CEO of Mercom Capital Group.
In 9M 2024, VC funding activity decreased 39% YoY, with $3.5 billion raised in 39 deals compared to the $5.7 billion raised in 51 deals in 9M 2023
Announced solar debt financing activity in 9M 2024 totaled $16.7 billion in 68 deals, 4% higher than 9M 2023, when $16 billion was raised in 54 deals.
In 9M 2024, 12 securitization deals totaled $3.8 billion, a 19% increase YoY compared to the $3.2 billion raised in 10 deals in 9M 2023.
There were 247 companies and investors covered in this report. It is 95 pages in length and contains 80 charts, graphs, and tables.
Mercom Capital Group’s Quarterly Solar Funding and M&A Reports are comprehensive high-quality reports delivering superior insight, market trends, and analysis. These reports help bring clarity to professionals in the current financial landscape of the solar industry.
Also available:
Custom Excel Sheets with all transactions for the quarter, and
Custom Research with data from the past 5 years!
Contact us to learn more and get pricing!
Quarterly market and deal activity displayed in easy-to-digest charts, graphs, and tables, alongside data-driven analysis.
The report covers all types of deals and financing activity, including:
- Venture capital funding deals, including top investors, QoQ and YoY trends, and a breakdown of charts and graphs by technology, sector, stage, and country;
- Large-scale project funding deals, including top investors, QoQ and YoY trends and breakdown charts and graphs by technology and country;
- Public market financing, including equity financing, private placements, and rights issues;
- Debt and other funding deals, as well as QoQ and YoY trends;
- Third-party residential/commercial project funds;
- Large-scale project acquisitions and active project acquirers;
- Large-scale project announcements in various levels of development throughout the world;
- Mergers and acquisitions (M&A), including QoQ and YoY trends, a breakdown of charts and graphs by technology and sector, as well as project M&A activity;
- New cleantech and solar funds;
- New large-scale project announcements;
- Large-scale project costs per MW.
This report also contains comprehensive lists of all announced Q3:
- VC funding, debt financing, public equity financing, and project funding deals;
- VC and project funding investors;
- M&A transactions;
- Project acquisitions by amounts and megawatts;
- M&A, and project M&A transactions;
- Large-scale project announcements.
Mercom’s comprehensive report covers deals of all sizes across the globe. Have questions about the report? Email us here.
RELATED PRODUCTS
Other reports you may be interested in
Q1 2026 Total Solar Corporate Funding
Totals $11 Billion
Bundle and Save 20%
Get Q1, Q2, Q3, and Q4 + Annual 2026 Wrap Up
9M and Q3 2025 Total Smart Grid Corporate Funding
Totals $2.8 Billion
9M and Q3 2025 Total Energy Storage Corporate Funding
Totals $11.2 Billion
9M 2025 Total Corporate Funding
Totals $17.3 Billion
1H and Q2 2025 Total Corporate Funding
Totals $10.8 Billion
Q1 2025 Total Corporate Funding
Totals $4.1 Billion
Bundle and Save 20%
Get Q1, Q2, Q3, and Q4 + Annual 2025 Wrap Up
Q4 2024 Annual Corporate Funding
Totals $26.3 Billion