

1H and Q2 2022 Solar Funding and M&A Report
Price range: $299.00 through $499.00
1H and Q2 2022 Total Corporate Funding
Totals $12 Billion
– See the Details!
Click here to download the Executive Summary.
Total corporate funding (including venture capital funding, public market, and debt financing) in 1H 2022 stood at $12 billion, 11% lower compared to the $13.5 billion raised in 1H 2021.
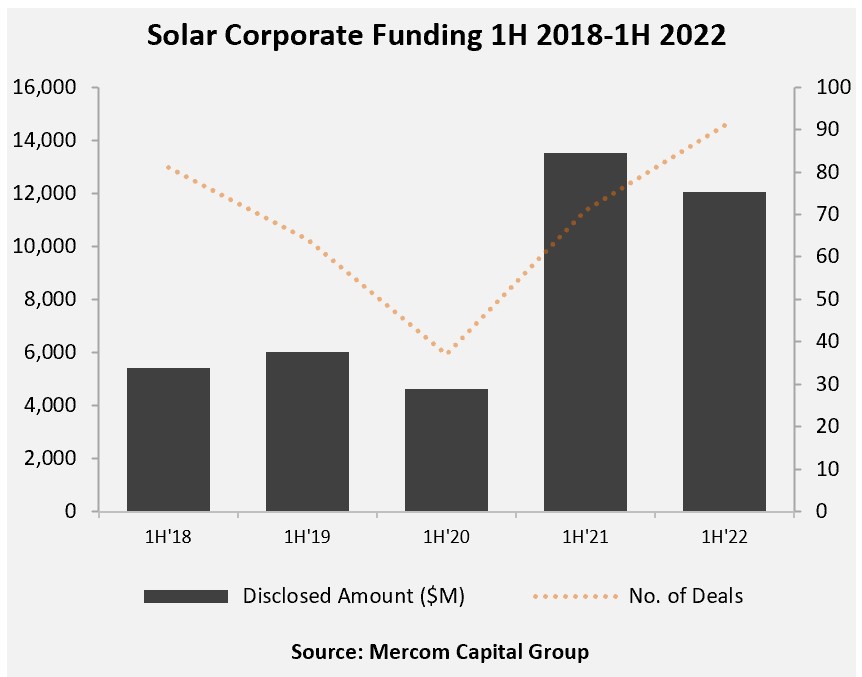
“The current state of the economy—inflation, higher interest rates, supply chain issues—has started to impact fundraising in the solar sector. Even though the first half numbers held up, there was a pronounced slowdown from Q1 to Q2. Besides venture and private equity funding, all other areas experienced a decline in financing activity. But the value of solar is more evident than ever to markets that are dependent on energy imports. Clean energy installation goals are being ramped up around the world, and solar is a long-term beneficiary of this trend,” said Raj Prabhu, CEO of Mercom Capital Group.
In 1H 2022, venture capital (VC) funding activity rose 125% with $3.7 billion in 53 deals compared to the $1.6 billion raised in 26 deals in the first half of 2021.
Announced solar debt financing activity in 1H 2022 ($5 billion in 30 deals) was 39% lower compared to the first half of 2021 when $8.2 billion was raised in 32 deals.
In 1H 2022, there were a total of 148 project acquisitions for 38 GW of solar projects compared to 136 project acquisitions totaling 40 GW in 1H 2021.
There were 391 companies and investors covered in this report. It is 100 pages in length and contains 84 charts, graphs, and tables.
Mercom Capital Group’s Quarterly Solar Funding and M&A Reports are comprehensive high-quality reports delivering superior insight, market trends, and analysis. These reports help bring clarity to professionals in the current financial landscape of the solar industry.
Also available:
Custom Excel Sheets with all transactions for the quarter, and
Custom Research with data from the past 5 years!
Contact us to learn more and get pricing!
Quarterly market and deal activity displayed in easy-to-digest charts, graphs, and tables, alongside data-driven analysis.
The report covers all types of deals and financing activity, including:
- Venture capital funding deals, including top investors, QoQ and YoY trends, and a breakdown of charts and graphs by technology, sector, stage, and country;
- Large-scale project funding deals, including top investors, QoQ and YoY trends and breakdown charts and graphs by technology and country;
- Public market financing, including equity financing, private placements, and rights issues;
- Debt and other funding deals, as well as QoQ and YoY trends;
- Third-party residential/commercial project funds;
- Large-scale project acquisitions and active project acquirers;
- Large-scale project announcements in various levels of development throughout the world;
- Mergers and acquisitions (M&A), including QoQ and YoY trends, a breakdown of charts and graphs by technology and sector, as well as project M&A activity;
- New cleantech and solar funds;
- New large-scale project announcements;
- Large-scale project costs per MW.
This report also contains comprehensive lists of all announced Q2:
- VC funding, debt financing, public equity financing, and project funding deals;
- VC and project funding investors;
- M&A transactions;
- Project acquisitions by amounts and megawatts;
- M&A, and project M&A transactions;
- Large-scale project announcements.
Mercom’s comprehensive report covers deals of all sizes across the globe. Have questions about the report? Email us here.
RELATED PRODUCTS
Other reports you may be interested in
1H 2026 Corporate Funding for solar companies
totals $16.9 billion
Q1 2026 Total Solar Corporate Funding
Totals $11 Billion
Bundle and Save 20%
Get Q1, Q2, Q3, and Q4 + Annual 2026 Wrap Up
9M and Q3 2025 Total Smart Grid Corporate Funding
Totals $2.8 Billion
9M 2025 Total Corporate Funding
Totals $17.3 Billion
1H and Q2 2025 Total Corporate Funding
Totals $10.8 Billion
Q1 2025 Total Corporate Funding
Totals $4.1 Billion
Bundle and Save 20%
Get Q1, Q2, Q3, and Q4 + Annual 2025 Wrap Up
Q4 2024 Annual Corporate Funding
Totals $26.3 Billion