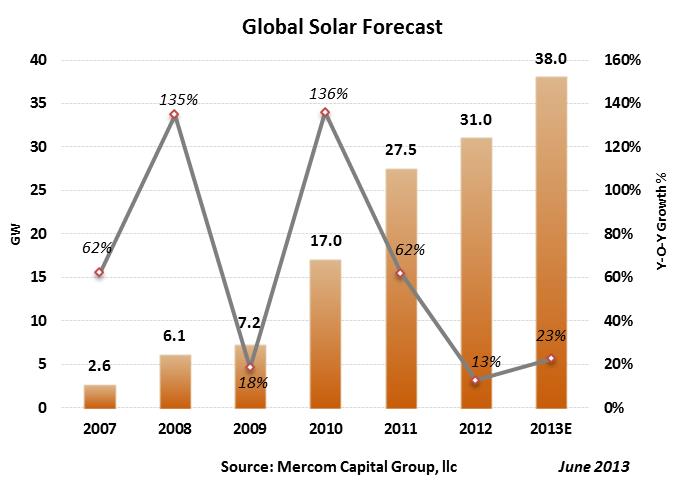
Amid all the bad news, bankruptcies and trade cases, global solar installations in 2012 totaled about 31 GW, a 13 percent year-over-year growth in a tough year. Demand for solar in 2013 looks promising despite the uncertainty surrounding the China-European Union (EU) trade case. A big reason for the improved outlook is due to the rise of Japan’s solar market, which is on pace to install in excess of 7 GW, compensating for the pullback in demand from Germany and Italy.
The darkest cloud hanging over the market currently is the China-EU trade case. The European Union recently imposed a provisional anti-dumping tariff of 11.8 percent on imports of solar panels, cells and wafers from China. The anti-dumping duty is to be implemented in a phased approach, with an 11.8 percent duty for the first two months (June 6, 2013 – August 6, 2013) followed by an average duty of 47.6 percent from August through December, by which time the European Commission will decide if it wants to impose the anti-dumping duties permanently for five years. The clear strategy behind this approach is to get both parties to the negotiating table and come up with a long term solution; which is a very prudent approach. It is in the best interest of both parties to negotiate. Failure will surely trigger an all-out trade war beyond the solar industry as retaliatory cases keep building up as witnessed by the China-EU trade case on polysilicon and the Chinese anti-dumping investigation of wine imports from the EU along with a probe on steel tubes imported from the EU, United States and Japan.
Other pending solar trade cases include: China’s anti-dumping case against polysilicon suppliers from the United States, the EU, and South Korea, India’s anti-dumping investigation on the imports of solar cells from Malaysia, China, Taiwan and the United States, and the EU’s anti-dumping investigation into the imports of solar glass from China. Meanwhile, the WTO ruled in favor of Japan and the EU on Ontario’s domestic content requirements, setting an important precedent.
In 2013, a significant share of global installations is forecasted to come from Japan and China. The Japanese government’s target of achieving 28 GW in PV installations by 2020 and generous feed-in-tariffs are driving installations in Japan.
In China, the government has set an aggressive target of installing 10 GW of solar in 2013 which will aid its domestic manufacturers, most of which are currently in severe financial trouble. Solar is also seen as a solution to the serious air pollution problems facing China.
Germany
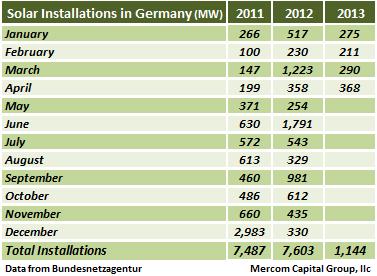
After record PV installations of 7.6 GW in Germany in 2012, the efforts to slow down installations by the German Federal Network Agency (Bundesnetzagentur) seem to be working. Only 1.1 GW of PV have been installed in the first four months of 2013 compared to almost 2.3 GW installed in the same period last year.
Bundesnetzagentur announced a phased reduction in FiTs to
slowdown PV installations to a desired level of about 3.5 GW per year. The tariff reductions between November 1, 2012, and January 31, 2013 was 2.5 percent per month, followed by monthly tariff reductions between February and April 2013 at a slightly lower rate of 2.2 percent and a 1.8 percent tariff reduction between May and July 2013.
Cumulative PV installations in Germany stood at 33.5 GW as of April 2013. Germany has a goal of subsidizing its solar program up to 52 GW.

Italy
Italy’s solar scheme, Conto Energia V, has come to an end as the annual cost of PV incentives paid out has almost reached the cap of €6.7B (~$8.55B) as of May 2013. With the Conto Energia cap almost reached, Italian PV installations will slowdown, but the positive for Italy is that most parts of the country have already reached grid parity due to a combination of excellent solar isolation and high electricity costs. Italian projects have one of the highest ROIs among developed markets. Without FiTs, markets will have to rely on other instruments like net metering, rebates and PPAs according to the draft guidelines currently under consultation.
United Kingdom
The United Kingdom installed almost 1 GW in 2012 and is on pace to install between 1.5 and 2 GW in 2013, entering the list of top markets to watch in 2013.
The United Kingdom has a FiT program which is the main driver of installations and is similar to Germany’s, with a degression schedule. The UK FiT program has nine groups: 0-4 kW, 4-10 kW, 10-50 kW, 50-100 kW, 100-150 kW, 150-250 kW, 250 kW-5 MW, stand-alone, and export tariff.
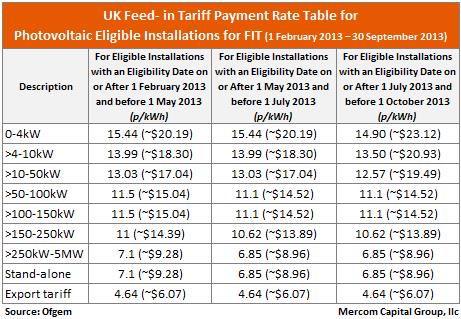
For the period starting May 1, 2013, tariffs range from ~$0.20/kWh for 0-4 kW size installations to ~$0.09/kWh for stand-alone installations.
United States
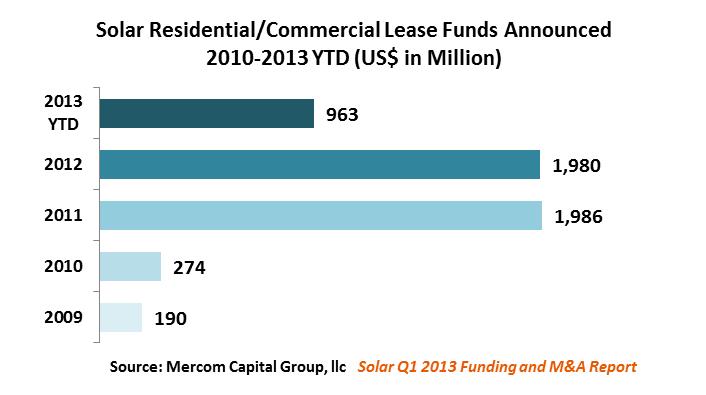
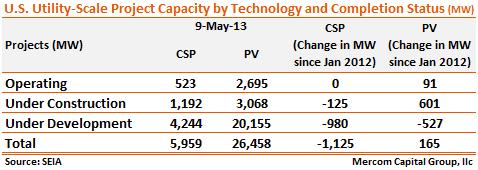
Installation growth continues in the United States at a steady, healthy clip. After installing over 3,000 MW in 2012, installations are forecasted to reach 4,500 MW in 2013. The continued growth in installations comes with the help of utility-scale projects and third party financed residential and commercial installations. Solar lease programs, where consumers lease systems instead of making the upfront investment, are extremely popular with over $2 billion raised in residential and commercial lease funds in 2012 and about $1 billion raised already in 2013.
So far, the impact from the anti-dumping ruling last year seems to have had a minimal effect on installations and the market has moved on. There are, however, other ongoing trade cases which create uncertainty, including the anti-dumping case filed by China against U.S. polysilicon makers, and an anti-dumping case filed by India against the United States in regards to solar panels. However, there are positive signs out there that parties are pursuing negotiations to resolve disputes.
The U.S. solar market is driven by state Renewable Portfolio Standards (RPS), state and municipal rebate programs and the 30 percent Federal Investment Tax Credit (ITC), which is valid until 2016. California, the largest solar market in the country with its aggressive RPS of 33 percent by 2020, is driving installations in the United States. Almost 30 states have some sort of RPS in place, and about half of them have a solar carve-out. The United States has so far avoided the boom and bust cycles witnessed in many markets that implemented generous FiTs and cutback later.
Japan
With the intention of diversifying its energy generation sources after the Fukushima disaster, Japan announced policies to aggressively promote renewable energy. The Ministry of Economy, Trade, and Industry (METI) announced a FiT program in June 2012, with PV systems below 10 kW receiving ¥42/kWh (~$0.53) and systems above 10 kW receiving ¥40/kWh (~$0.51). METI announced a 10 percent cut in tariffs to ~¥38 (~$0.40) starting April 1, 2013, still one of the most generous solar feed-in-tariffs in the world.
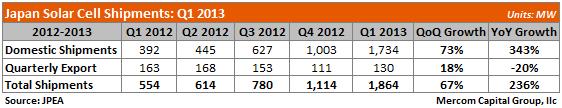
The generous FiTs and high rate of returns have helped spur growth. Domestic PV shipments have continued to rise exponentially, with about 1.7 GW of domestic shipments recorded in Q1 2013 alone, which is a 73 percent growth rate quarter-over-quarter, and a whopping 343 percent increase year-over-year. This puts Japan on course to post strong installation numbers in 2013, just in time to pick up the slack from Germany and Italy as installations slowdown in those countries. Challenges in Japan include the availability of land and transmission bottleneck issues.
Japan has set a goal of achieving 28 GW of cumulative PV installations by 2020.
China
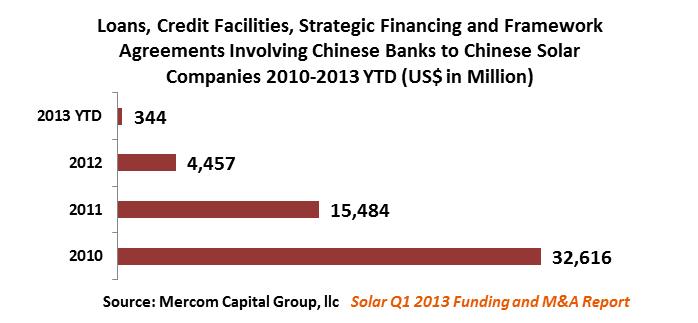
The current Chinese push towards aggressive solar installations is driven by two important factors. The first is to help domestic solar manufacturers who are in severe financial trouble after years of oversupply, a steep fall in prices and lack of profits. The second is because solar is now seen as a solution to the serious air pollution problems in China.
The providing of billions of dollars in credit to Chinese manufacturers by Chinese banks to ramp-up capacity had the unintended consequence of massive overcapacity, which led to a steep fall in panel prices, further leading the demise or severe financial troubles for most of its manufacturers. The anti-dumping cases have made the situation worse. Creating strong domestic demand is seen as a way out. With the announcement of an 11.8 percent provisional anti-dumping tariff by the European Union, which could escalate to 47.6 percent by August, there is a serious push towards new subsidies and programs to stimulate demand. Some proposals may include FiT support for both grid connected and distributed solar. Grid connected FiT proposals include setting tariffs by region (four regions) in the ~$0.12 to ~$0.17/kWh range. For distributed PV, there are proposals to set tariffs by commercial, industrial and residential users. In addition, surplus generated is also proposed to be purchased by utilities at a tariff.
The Chinese solar industry still faces significant challenges including economic slowdown, significant debt exposure to solar manufacturers, low tariffs, bureaucracy, and transmission bottlenecks, along with widespread trade disputes.
India
Indian solar installations have been driven by the Jawaharlal Nehru National Solar Mission (JNNSM) with a goal to install 20 GW of solar power by 2022, and various state policies and state RPOs.
India installed 980 MW in 2012, and has installed about 600 MW of solar so far in 2013. With most of the CSP projects that were due to be commissioned in May 2013 delayed, the forecast for installations in 2013 looks flat compared to 2012.
Long touted to be a fast growing emerging solar market where the growth rate is expected to be much higher than other parts of the world, installations in 2013 will likely be disappointing.
Here is a detailed update of the Indian solar market.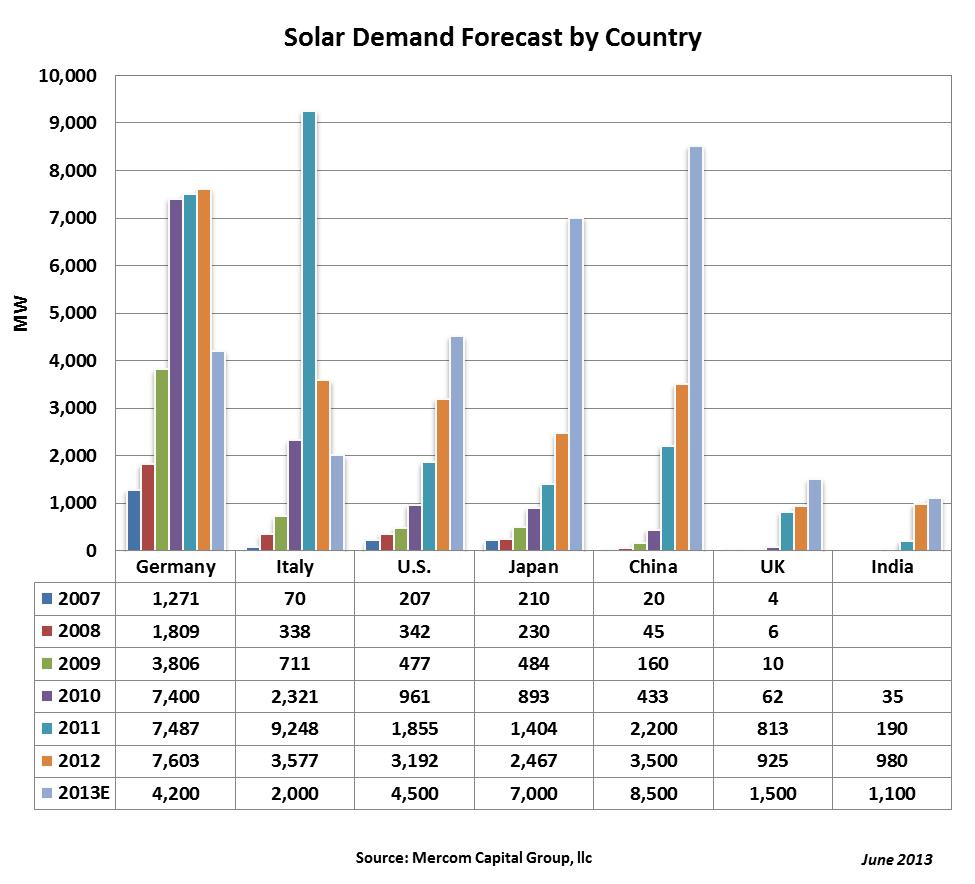 This consensus forecast is based on Mercom’s views and methodology with data compiled from: BNEF, Credit Suisse, Deutsche Bank, EPIA, EuPD, GTM Research, Hyundai, IHS iSuppli, KGI, Macquarie Capital, Maxim Group, Mercom Capital Group, Solarbuzz, SEIA, Mirae, Digitimes, Fubon Research, ICBC China, KDB Daewoo, Raymond James, Woori, Yuanta, IMS Research, Bundesnetzagentur, Enerplan, GSE, JPEA, METI, NEA, MNRE and other government, public and private sources.